
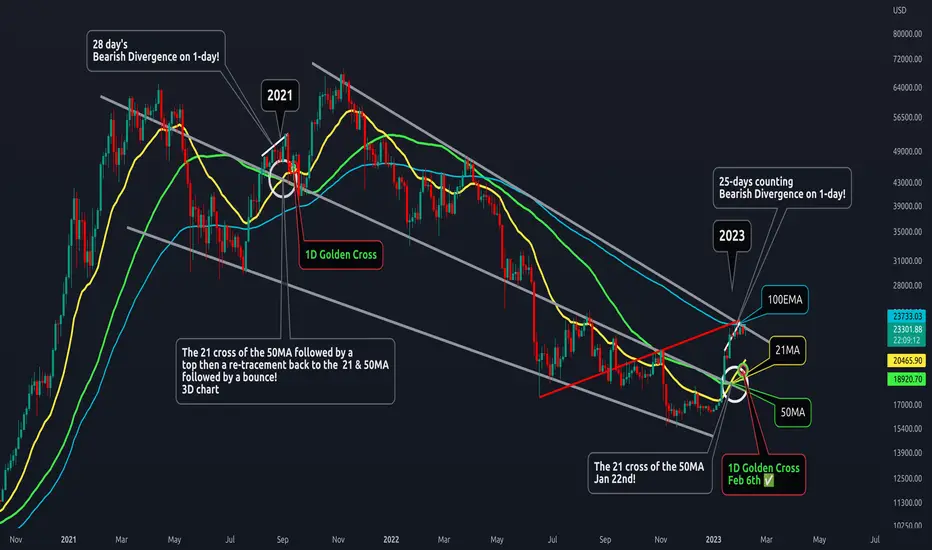
A follow on to our last 2 charts covering BTC's 3-day Pattern!
The 1-day Golden Cross has occurred and each time that it has in the past, BTC retraced just before or just after.
Also following the cross of the 21 Moving Average Crossing above the 50MA, BTC retraced back to the 50 as id did in 2021, and crashing through it in 2015 and 2020.
I have also noted that on the 1-day chart, BTC has been forming Bearish Divergence. 2021 was 28 days, current price action is 25-days!
Will BTC follow these past patterns or can it do the unexpected and break through our 100EMA and out-trend resistance?
The 1-day Golden Cross has occurred and each time that it has in the past, BTC retraced just before or just after.
Also following the cross of the 21 Moving Average Crossing above the 50MA, BTC retraced back to the 50 as id did in 2021, and crashing through it in 2015 and 2020.
I have also noted that on the 1-day chart, BTC has been forming Bearish Divergence. 2021 was 28 days, current price action is 25-days!
Will BTC follow these past patterns or can it do the unexpected and break through our 100EMA and out-trend resistance?
註釋
Update: The Bearish Divergence was 27 days 2021 and 27 days 2023!
免責聲明
這些資訊和出版物並非旨在提供,也不構成TradingView提供或認可的任何形式的財務、投資、交易或其他類型的建議或推薦。請閱讀使用條款以了解更多資訊。