
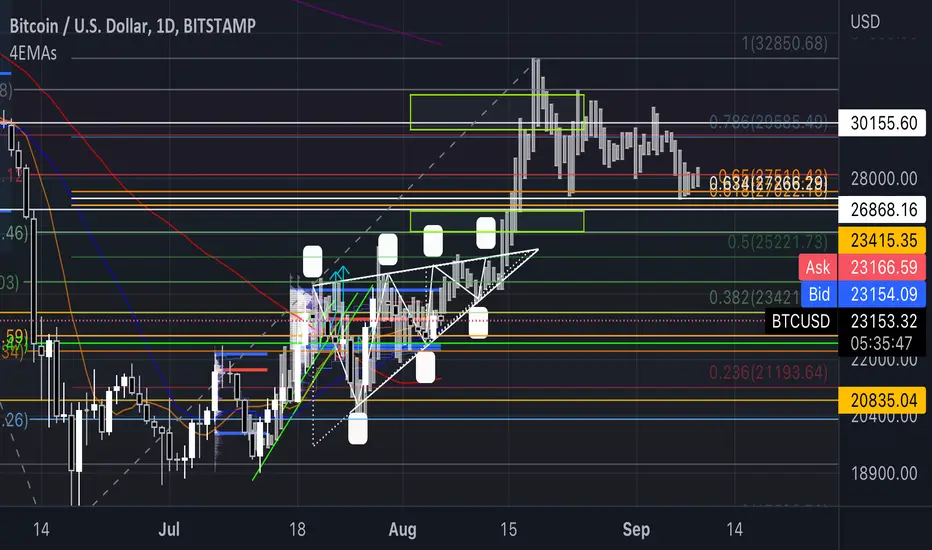
I’m just gonna leave this here. What you’re looking at is a bar pattern copy of a previous move bitcoin has made overlaid onto the current chart - One that just so happens to align nearly perfectly with the Fibonacci levels, from the last daily swing low, to the hypothetically soon-coming swing hight, which would put the upcoming 0.382 at around $23,421, the golden pocket $27,000-$27,500 range, the 0.786 at around $29,585 and the 1.0 at $32,850, peaking there, sometime around August 15th to August 18th.
Let me know what y’all think.
***I’m not a Financial advisor nothing I said is financial advice and you shouldn’t buy or sell anything just because I discussed it in this post. You, and you alone are responsible for your financial decisions and risk management.
Let me know what y’all think.
***I’m not a Financial advisor nothing I said is financial advice and you shouldn’t buy or sell anything just because I discussed it in this post. You, and you alone are responsible for your financial decisions and risk management.

免責聲明
這些資訊和出版物並非旨在提供,也不構成TradingView提供或認可的任何形式的財務、投資、交易或其他類型的建議或推薦。請閱讀使用條款以了解更多資訊。
免責聲明
這些資訊和出版物並非旨在提供,也不構成TradingView提供或認可的任何形式的財務、投資、交易或其他類型的建議或推薦。請閱讀使用條款以了解更多資訊。