
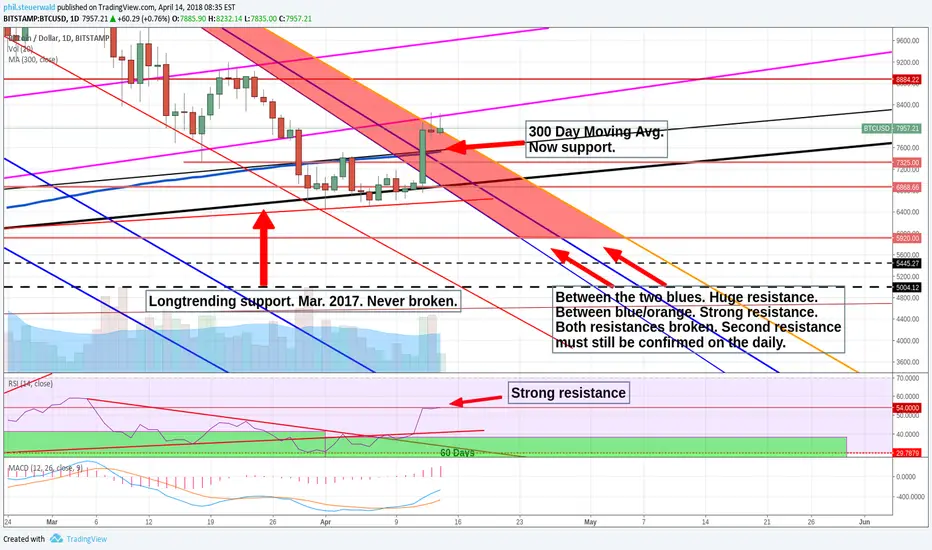
Though I'm not 100% bullish yet, I can honestly say that this is the first time in 4 long months that the charts are showing me some positive signs of turning bullish.
Here's what I see:
#1 - A break above the top of our long 4 month down-trending BLUE channel. This is the first time BTC has made this break. Barely, but the green shoots of BTC spring are showing.
#2 - Our long-trending (+1yr) BLACK support has NOT been broken. This has held us up since MARCH 2017.
#3 - We broke back above our 300 day moving average. This can now act as strong support for us.
I think that this is the first time since December I have able to list at least 3 strongly positive signs that may be showing us Bitcoin may be starting to turn.
Keep in mind, longer term trends needs a longer turning radius. I don't believe we will just turn on a dime. But if we can keep from re-entering this bearish channel. it is definitely a positive sign for good old BTC.
The one thing we need to keep a close watch on this weekend is a re-entry back into the bearish channel. We still have not really had good confirmation on the daily that we are completely out of our bear channel. I believe if we are to completely clear this bear channel, BTC must break back above that 54 resistance on the RSI. And, we need a close above 7.9k and the close of Sunday's candle to stay above 7.8k for this confirmation.
My sentiment remains neutral to cautiously optimistic at this point. Starting to turn bullish.
Peace and happy trades my crypto friends.
註釋
Another bullish indicator reveals itself! 54 on the RSI has been hurdled. There was a time when BTC did not drop BELOW 54 for a span of a few years. Once it did, it was a big bear indicator. Now, everytime it crosses this marker to the upside on the daily, it is another strong bullish indicator that we should all pay close attention to!
註釋
A close above that top PINK trendline would be awesome! Go BTC!
註釋
Just closed and opened above the PINK trendline on the daily! That is huge!
註釋
Couldn't stay above the PINK TL. Broke down. Formed a bullish flag. And now we are testing it again. Things are looking good folks!
註釋
Be careful here friends. This is not ideal! 50dma coming down to intersect with that very strong, very resistant PINK TL. Could spell trouble?
註釋
Broke 50dma and PINK TL again. Next stop 8884. ...And then? Anyone's guess. Although, we are out of the bear channel (and I am bullish about that), we have yet to make higher highs and these bulls have not really taken this market by storm as expected. In other words, I am still getting a few mixed signals and we are not fully bullish yet. Cautious trading is still advised.
註釋
This basic chart shows the logarithmic downtrend line (PURPLE). Simply put, we'll need to break above this downtrend line and confirm (preferably on the WEEKLY) for me to become a full on bull again. This weekend will be the tell. Watch closely.
註釋
Broke above LOG resistance. Now hitting .382 fib re-tracement. Must confirm breakout on daily with tomorrow's closing candle remaining above top of PURPLE.
註釋
That last candle needs to remain ABOVE the PURPLE trendline to confirm this last bullish move. We must close above $8500 today (8pm EST) to confirm this bullish indicator.
One of the last bearish indicators remaining was that BTC still lived below this declining logarithmic trendline. Should we close above it tonight, there are not many more cases for remaining bearish.

Stewdamus Trades -
Prophesying the price action of markets one chart at a time.
Crypto predictions, targets, how-tos, and much, much more!
Never miss a prophecy. Sign up for my free newsletter at:
stewdam.us
Prophesying the price action of markets one chart at a time.
Crypto predictions, targets, how-tos, and much, much more!
Never miss a prophecy. Sign up for my free newsletter at:
stewdam.us
相關出版品
免責聲明
這些資訊和出版物並非旨在提供,也不構成TradingView提供或認可的任何形式的財務、投資、交易或其他類型的建議或推薦。請閱讀使用條款以了解更多資訊。
Stewdamus Trades -
Prophesying the price action of markets one chart at a time.
Crypto predictions, targets, how-tos, and much, much more!
Never miss a prophecy. Sign up for my free newsletter at:
stewdam.us
Prophesying the price action of markets one chart at a time.
Crypto predictions, targets, how-tos, and much, much more!
Never miss a prophecy. Sign up for my free newsletter at:
stewdam.us
相關出版品
免責聲明
這些資訊和出版物並非旨在提供,也不構成TradingView提供或認可的任何形式的財務、投資、交易或其他類型的建議或推薦。請閱讀使用條款以了解更多資訊。