
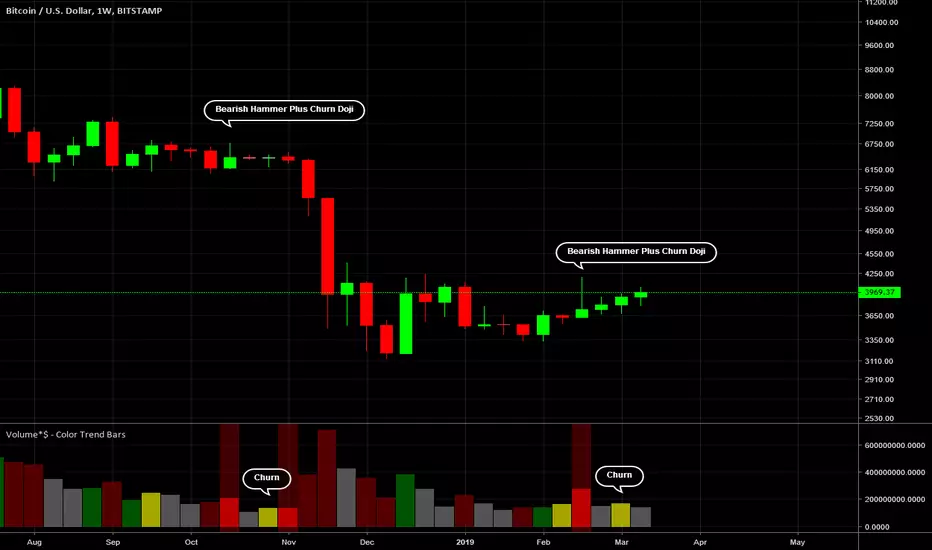
I've updated my volume indicator to emphasize hammer bars. The usual pattern is:
1.) Hammer bar with wick hanging out in the middle of space. On volume indicator these are colored bright red or green.
2.) Highish volume but low range doji which indicates churning where the bulls and bears actively fight but are not able to move price very much. On volume indicator these are colored yellow.
3.) Trend bars - price typically breaks away from the wick of the hammer which was the initial rejection area. On volume indicator these are colored dark red or green.
The hammer and churn doji recently completed on the week chart for BTC so I am watching very closely for a double top on lower timeframes because I expect a big downward trend bar to appear within a month.
1.) Hammer bar with wick hanging out in the middle of space. On volume indicator these are colored bright red or green.
2.) Highish volume but low range doji which indicates churning where the bulls and bears actively fight but are not able to move price very much. On volume indicator these are colored yellow.
3.) Trend bars - price typically breaks away from the wick of the hammer which was the initial rejection area. On volume indicator these are colored dark red or green.
The hammer and churn doji recently completed on the week chart for BTC so I am watching very closely for a double top on lower timeframes because I expect a big downward trend bar to appear within a month.

免責聲明
這些資訊和出版物並非旨在提供,也不構成TradingView提供或認可的任何形式的財務、投資、交易或其他類型的建議或推薦。請閱讀使用條款以了解更多資訊。