
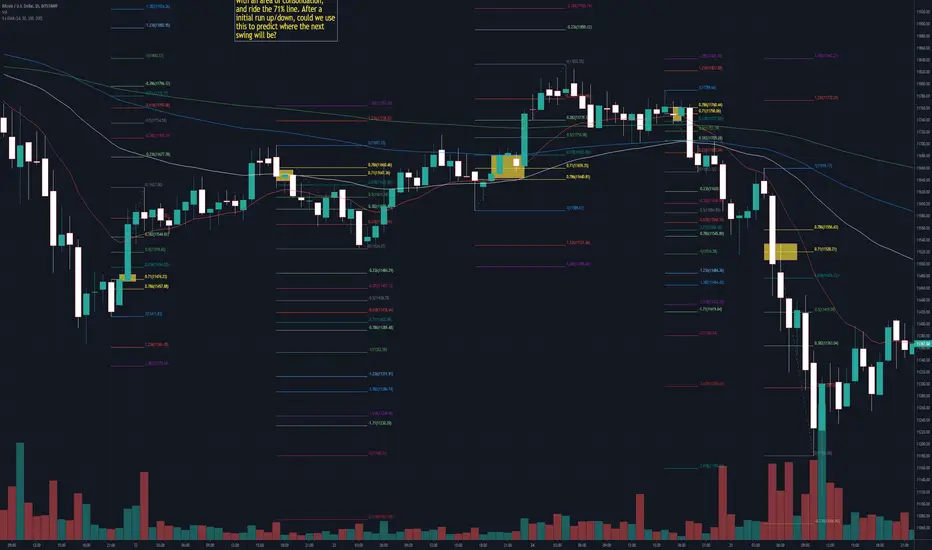
I have started to notice that, when I draw my Fib's, between the initial run from 1.0 to 0.0, the 0.71 often ends up aligning with an area of consolidation, and ride the 71% line. After a initial run up/down, could we use this to predict where the next swing will be?

免責聲明
這些資訊和出版物並非旨在提供,也不構成TradingView提供或認可的任何形式的財務、投資、交易或其他類型的建議或推薦。請閱讀使用條款以了解更多資訊。