
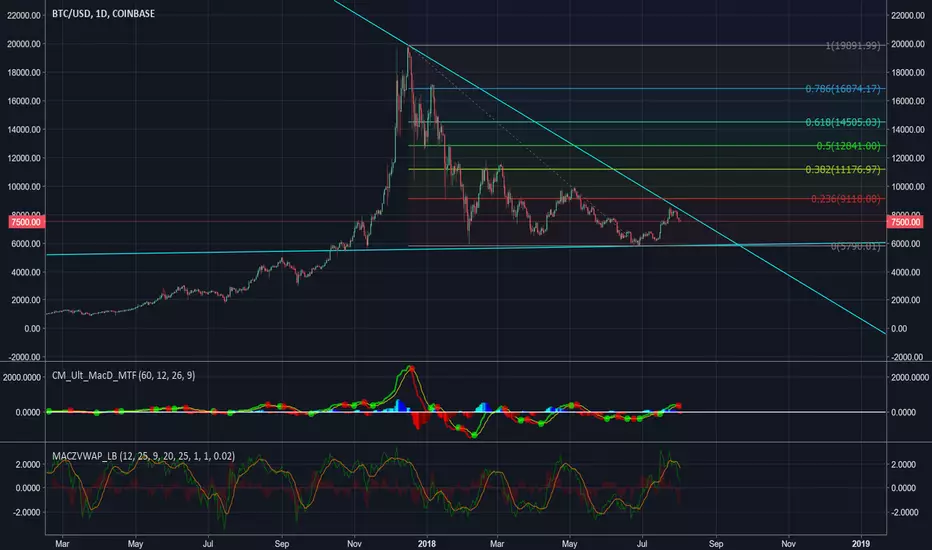
Zooming out is the best strategy to look at long term trends. It looks like ~8400 was the top of our third fractal pattern.
Is it possible bitcoin is forming one massive bull flag? Or will ~5800 break? Either way, it looks like ~5800 is still in play...
Just an thought. Share your ideas below!
Is it possible bitcoin is forming one massive bull flag? Or will ~5800 break? Either way, it looks like ~5800 is still in play...
Just an thought. Share your ideas below!
註釋
EMA ribbon is on but hidden from view in order to see the overall chart better.
免責聲明
這些資訊和出版物並非旨在提供,也不構成TradingView提供或認可的任何形式的財務、投資、交易或其他類型的建議或推薦。請閱讀使用條款以了解更多資訊。