
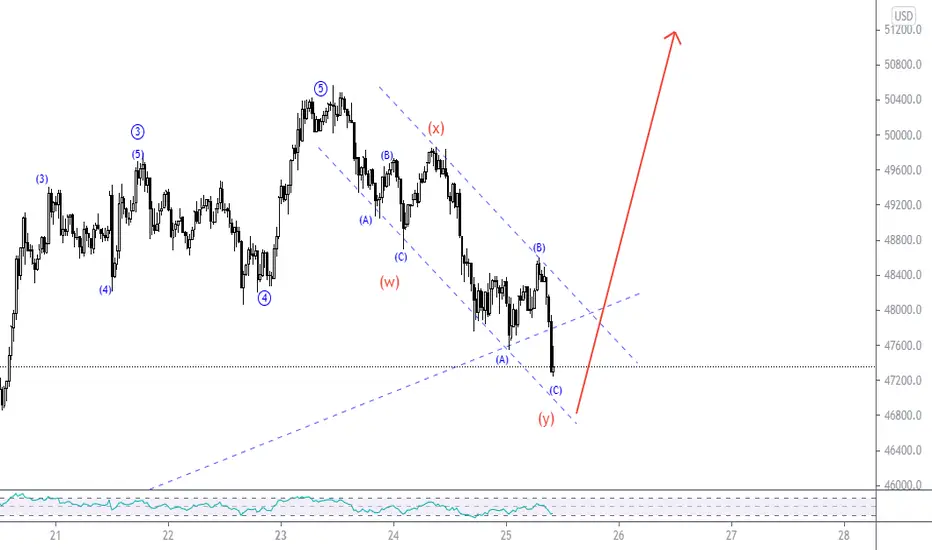
My analysis on btcUsd 30-minute chart Shows a potential corrective structure since we recognize an A-B-C structure that forms the first leg of double zig zag correction wave(w) and another A-B-C structure that makes up the last leg of the double combo.
Also, there is a descending parallel channel supporting the corrective strucre, I expect the corrective wave should terminate any time soon and then wait for a bullish confirmation signal to prepare for the next bullish move.
Also, there is a descending parallel channel supporting the corrective strucre, I expect the corrective wave should terminate any time soon and then wait for a bullish confirmation signal to prepare for the next bullish move.

免責聲明
這些資訊和出版物並非旨在提供,也不構成TradingView提供或認可的任何形式的財務、投資、交易或其他類型的建議或推薦。請閱讀使用條款以了解更多資訊。
免責聲明
這些資訊和出版物並非旨在提供,也不構成TradingView提供或認可的任何形式的財務、投資、交易或其他類型的建議或推薦。請閱讀使用條款以了解更多資訊。