
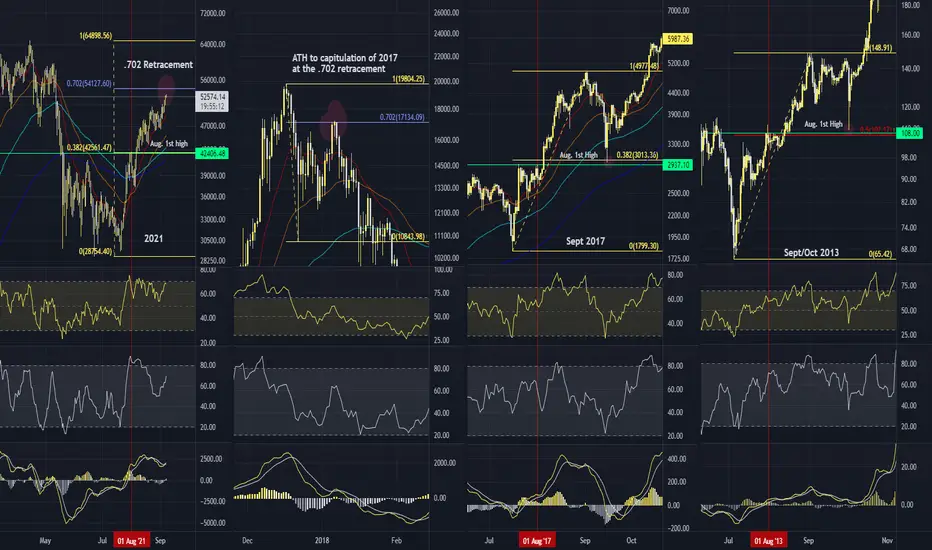
4 Charts - 3 Different times we were in similar predicaments.
I wouldn't subscribe to any of these scenarios and allow time to tell you which one we may be following for guidance. Likely, we don't follow any; however, there are many characteristics that have been rhyming with past cycles... so with this, I see a little better.
- Scenario 1: following 2017's All Time High, we capitulated and rebounded to the 0.702 retracement and went into a bear market. This is currently sitting at about 54k.
- Scenario 2: July we reversed the downtrend [like now], and had a semi-substantial drop in Sept/Oct to as low as the 0.5 fib or the August 1st high. That fib is 47k and the August 1st high was 43k. This was followed by the last push to the ATH
- Scenario 3: July we reversed the downtrend [again], and had a substantial drop in Sept/Oct to as low as the .382 fib or the August 1st high That fib is 43k and the August high was also 43k. This was followed by the last push to the ATH
I wouldn't subscribe to any of these scenarios and allow time to tell you which one we may be following for guidance. Likely, we don't follow any; however, there are many characteristics that have been rhyming with past cycles... so with this, I see a little better.
交易進行
Hit August 1st high [or as close as other cycles anyway]. See if it holds.交易進行
Fell through August 1st high & since rebounded. Show-time
相關出版品
免責聲明
這些資訊和出版物並非旨在提供,也不構成TradingView提供或認可的任何形式的財務、投資、交易或其他類型的建議或推薦。請閱讀使用條款以了解更多資訊。