
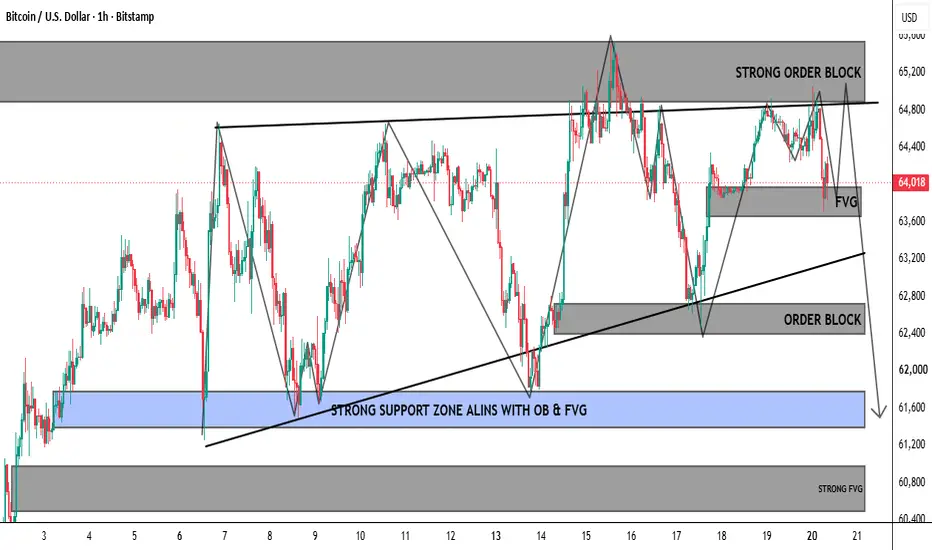
Bitcoin (BTC/USD) on the 1-hour timeframe is trading within a well-defined ascending structure, but current price action suggests that the market is approaching a critical decision zone. The chart highlights a strong confluence of Order Blocks (OBs), Fair Value Gaps (FVGs), and trendline resistance, indicating that institutional supply may be entering the market after an extended bullish rally.
Price recently rallied into the highlighted Strong Order Block, which has previously acted as a significant institutional supply zone. This area aligns closely with the upper boundary of the ascending structure, making it a high-probability region for bearish reactions. The inability of buyers to establish a sustained breakout above this resistance increases the likelihood of profit-taking and fresh selling pressure.
The marked Fair Value Gap (FVG) below current price represents an unfilled market imbalance that often attracts price back for rebalancing. If Bitcoin continues to reject from the current resistance zone, the first downside objective would likely be this FVG, where price may temporarily stabilize before deciding its next directional move.
A break below the FVG would expose the highlighted Order Block near the lower trendline. This demand zone previously generated a strong bullish reaction and could once again provide support. However, if sellers gain momentum and force a decisive breakdown below this Order Block, it would confirm a bearish market structure shift and significantly increase the probability of a deeper correction.
The blue Strong Support Zone, which aligns with both a historical Order Block and a Fair Value Gap, remains one of the most important demand areas on the chart. This level has repeatedly attracted institutional buying and could become the primary downside target if bearish momentum accelerates. A successful defense of this support may trigger another bullish reversal, while a clean break below it would likely signal the beginning of a larger corrective phase.
From a Smart Money Concepts (SMC) perspective, the current price action reflects a market testing premium liquidity after an extended expansion. Institutions often distribute positions near major resistance before allowing price to retrace toward discounted areas where fresh demand can emerge. Traders should closely monitor price behavior around the highlighted Order Block and FVG for confirmation rather than entering positions prematurely.
Key Levels to Watch:
Resistance: Strong Order Block and upper trendline resistance.
Immediate Support: Fair Value Gap (FVG).
Major Support: Lower Order Block and ascending trendline.
Final Demand Zone: Strong Support Zone aligned with both Order Block and Fair Value Gap.
Bullish Scenario: A confirmed breakout and H1 close above the Strong Order Block could invalidate the bearish outlook and open the door for further upside.
Bearish Scenario: Continued rejection from the Order Block followed by a break below the FVG would strengthen the case for a move toward the lower Order Block and eventually the major support zone.
Overall, BTC/USD remains at a critical technical level where institutional resistance is clearly visible. Unless buyers can reclaim and hold above the highlighted supply zone, the chart continues to favor a short-term bearish correction before the next major directional move develops. Traders should wait for confirmation through market structure, liquidity sweeps, and candlestick reactions while maintaining disciplined risk management.
Price recently rallied into the highlighted Strong Order Block, which has previously acted as a significant institutional supply zone. This area aligns closely with the upper boundary of the ascending structure, making it a high-probability region for bearish reactions. The inability of buyers to establish a sustained breakout above this resistance increases the likelihood of profit-taking and fresh selling pressure.
The marked Fair Value Gap (FVG) below current price represents an unfilled market imbalance that often attracts price back for rebalancing. If Bitcoin continues to reject from the current resistance zone, the first downside objective would likely be this FVG, where price may temporarily stabilize before deciding its next directional move.
A break below the FVG would expose the highlighted Order Block near the lower trendline. This demand zone previously generated a strong bullish reaction and could once again provide support. However, if sellers gain momentum and force a decisive breakdown below this Order Block, it would confirm a bearish market structure shift and significantly increase the probability of a deeper correction.
The blue Strong Support Zone, which aligns with both a historical Order Block and a Fair Value Gap, remains one of the most important demand areas on the chart. This level has repeatedly attracted institutional buying and could become the primary downside target if bearish momentum accelerates. A successful defense of this support may trigger another bullish reversal, while a clean break below it would likely signal the beginning of a larger corrective phase.
From a Smart Money Concepts (SMC) perspective, the current price action reflects a market testing premium liquidity after an extended expansion. Institutions often distribute positions near major resistance before allowing price to retrace toward discounted areas where fresh demand can emerge. Traders should closely monitor price behavior around the highlighted Order Block and FVG for confirmation rather than entering positions prematurely.
Key Levels to Watch:
Resistance: Strong Order Block and upper trendline resistance.
Immediate Support: Fair Value Gap (FVG).
Major Support: Lower Order Block and ascending trendline.
Final Demand Zone: Strong Support Zone aligned with both Order Block and Fair Value Gap.
Bullish Scenario: A confirmed breakout and H1 close above the Strong Order Block could invalidate the bearish outlook and open the door for further upside.
Bearish Scenario: Continued rejection from the Order Block followed by a break below the FVG would strengthen the case for a move toward the lower Order Block and eventually the major support zone.
Overall, BTC/USD remains at a critical technical level where institutional resistance is clearly visible. Unless buyers can reclaim and hold above the highlighted supply zone, the chart continues to favor a short-term bearish correction before the next major directional move develops. Traders should wait for confirmation through market structure, liquidity sweeps, and candlestick reactions while maintaining disciplined risk management.

免責聲明
這些資訊和出版物並非旨在提供,也不構成TradingView提供或認可的任何形式的財務、投資、交易或其他類型的建議或推薦。請閱讀使用條款以了解更多資訊。
免責聲明
這些資訊和出版物並非旨在提供,也不構成TradingView提供或認可的任何形式的財務、投資、交易或其他類型的建議或推薦。請閱讀使用條款以了解更多資訊。