
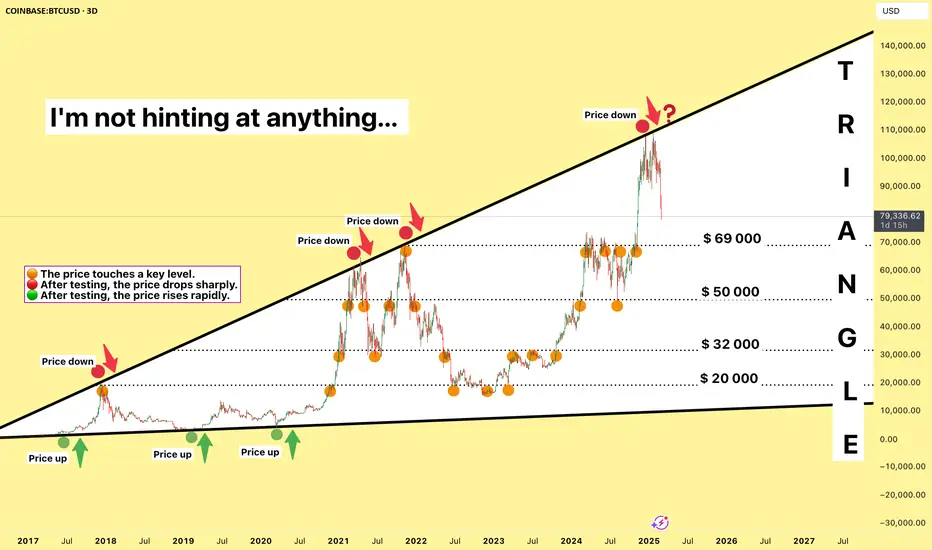
Hey, traders! 👋 Bitcoin is currently forming an inverted triangle, a pattern that often signals strong volatility ahead. Take a close look at the chart—I've marked key moments with different colored circles:
🟠 The price touches a key level.
🔴 After testing, the price drops sharply.
🟢 After testing, the price rises rapidly.
The levels are clearly visible on the chart, but what happens next? That’s the big question!
I’m not hinting at anything—this chart is open for interpretation. Everyone sees what they want to see, or maybe it helps deepen your own analysis.
So, what do YOU see? Where is Bitcoin headed next? Let’s discuss in the comments!
Thanks for Your attention🫶
Sincerely Yours, Kateryna 💛
🟠 The price touches a key level.
🔴 After testing, the price drops sharply.
🟢 After testing, the price rises rapidly.
The levels are clearly visible on the chart, but what happens next? That’s the big question!
I’m not hinting at anything—this chart is open for interpretation. Everyone sees what they want to see, or maybe it helps deepen your own analysis.
So, what do YOU see? Where is Bitcoin headed next? Let’s discuss in the comments!
Thanks for Your attention🫶
Sincerely Yours, Kateryna 💛
交易進行
The MACD indicator is usually very informative on the weekly chart.

免責聲明
這些資訊和出版物並非旨在提供,也不構成TradingView提供或認可的任何形式的財務、投資、交易或其他類型的建議或推薦。請閱讀使用條款以了解更多資訊。