
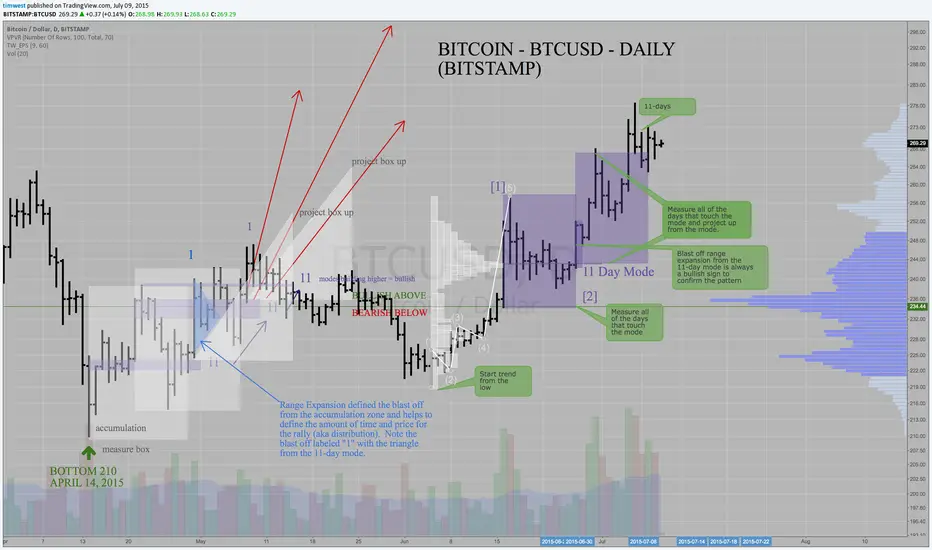
Bitcoin rallied to the timemode targets based on the methodology I have presented here at TradingView. You can do the analysis yourself by following the guidelines.
The analysis on the left hand side of the chart is untouched from the last chart I published (see link below for original chart).
The current rally completed an 11-day rally out of the 11-day mode that was created at the 243 level. The range around the mode was 258 to 234, which when you add the 24 point range to the 243 level provided an upside target of 267 which the market reached in 4 days. The action since then is also bullish and the mode is rising and there are many bullish signs within the price action that are long term bullish. The buyers are aggressive and they are clearing out the sellers.
I look forward to pointing out the next trade as it sets up.
Tim 11:53PM July 9, 2015
The analysis on the left hand side of the chart is untouched from the last chart I published (see link below for original chart).
The current rally completed an 11-day rally out of the 11-day mode that was created at the 243 level. The range around the mode was 258 to 234, which when you add the 24 point range to the 243 level provided an upside target of 267 which the market reached in 4 days. The action since then is also bullish and the mode is rising and there are many bullish signs within the price action that are long term bullish. The buyers are aggressive and they are clearing out the sellers.
I look forward to pointing out the next trade as it sets up.
Tim 11:53PM July 9, 2015

Join me in the trading room KEY HIDDEN LEVELS here at TradingView.com
相關出版品
免責聲明
這些資訊和出版物並非旨在提供,也不構成TradingView提供或認可的任何形式的財務、投資、交易或其他類型的建議或推薦。請閱讀使用條款以了解更多資訊。
相關出版品
免責聲明
這些資訊和出版物並非旨在提供,也不構成TradingView提供或認可的任何形式的財務、投資、交易或其他類型的建議或推薦。請閱讀使用條款以了解更多資訊。