
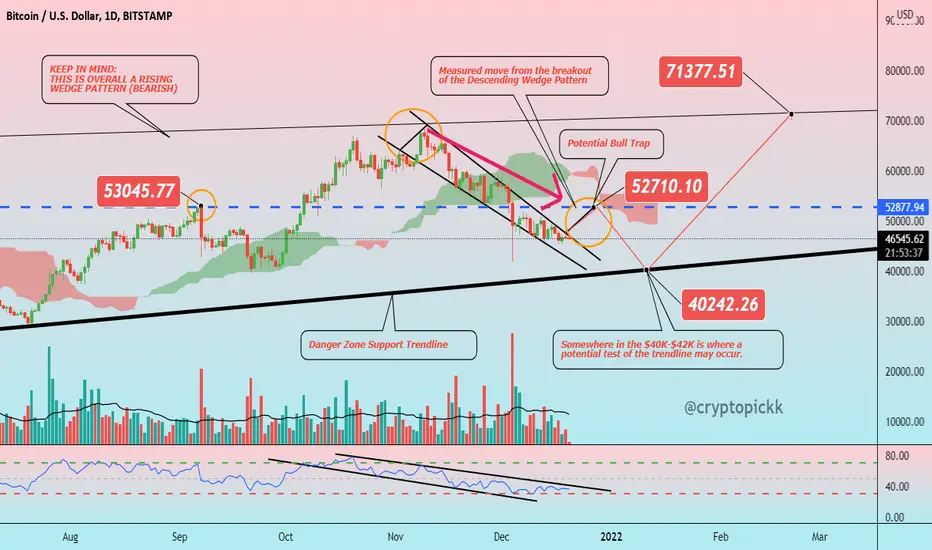
Hello friends, today you can review the technical analysis idea on a 1D linear scale chart for Bitcoin ( BTCUSD ), a cryptocurrency.
The chart is self-explanatory. The overall pattern is a Rising Wedge, but the price may still have potential to get back to the top of the pattern before it has a major drop.
Additionally Shown: Ichimoku Clouds, RSI (relative strength index), Support and Resistance Trendline, and Volume
If you enjoy my ideas, feel free to like it and drop in a comment. I love reading your comments below.
As the year is coming to an end and holidays are almost here. I want to wish my friends Happy Holidays and ready for an exciting 2022! What are your thoughts for the coming year?
Disclosure: This is just my opinion and not any type of financial advice. I enjoy charting and discussing technical analysis . Don't trade based on my advice. Do your own research! #cryptopickk
註釋
Bull trap exactly as predicted. Keep an eye on the lower levels. We may be headed between $40K-$42K.
相關出版品
免責聲明
這些資訊和出版物並非旨在提供,也不構成TradingView提供或認可的任何形式的財務、投資、交易或其他類型的建議或推薦。請閱讀使用條款以了解更多資訊。