
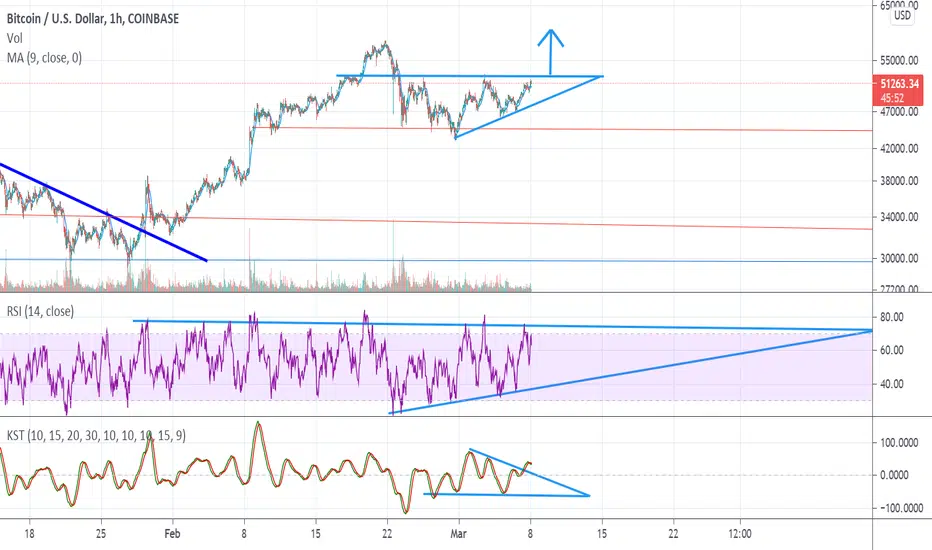
After breaking out from a crude bullish flag or what could have been considered a descending triangle linked to this post, BTC has consolidated into an Ascending Triangle drawn in light blue.
On the RSI there is a similar pattern as the price action, notice the series of higher lows along with the blue upward sloping support of the Ascending Triangle.
On the KST there's been a breakout of potentially a bullish flag pattern on a macro level, on a micro time frame there's been a bearish cross displaying the red line crossing over downward of the green line.
On the RSI there is a similar pattern as the price action, notice the series of higher lows along with the blue upward sloping support of the Ascending Triangle.
On the KST there's been a breakout of potentially a bullish flag pattern on a macro level, on a micro time frame there's been a bearish cross displaying the red line crossing over downward of the green line.

免責聲明
這些資訊和出版物並非旨在提供,也不構成TradingView提供或認可的任何形式的財務、投資、交易或其他類型的建議或推薦。請閱讀使用條款以了解更多資訊。