
It's great to be back posting regularly, today I'll be analysing the similarities in market cycles for bitcoin.
For reference we have two charts we are going to be focusing on (use the two for comparison).
Chart #1: 2011-2014 (all time high $1160)

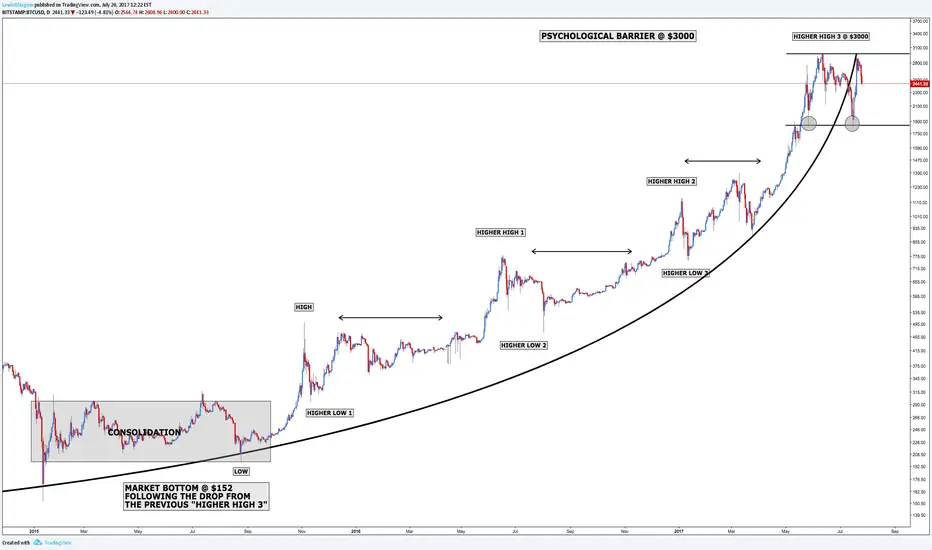
Chart #2: 2015-2017 (all time high $3000)

The analysis displayed in front of you is similar to my Siacoin prediction which was extremely successful (chart is shown below).
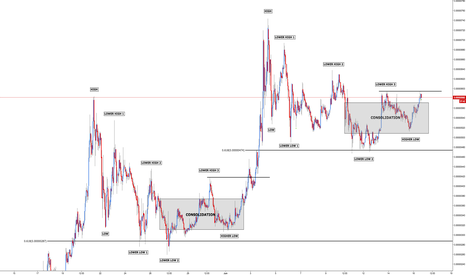
This is the reasoning behind the title "Rinse and Repeat x2".
Now back to the point, bitcoin... As you can see from charts #1 and #2 they both follow a similar cycle, although, years apart.
Many would call this structure a parabolic curve, however, I prefer the lows touching the curve.
Both moves start of from low to high and finish on higher high 3 at their all time high, from there a double test of support can be seen on both charts.
I'm expecting a move to support around $1800 as my first target, from there I will update my analysis.
With August 1st around the corner it will be interesting to see the future direction.
As always thank you for your support!
For reference we have two charts we are going to be focusing on (use the two for comparison).
Chart #1: 2011-2014 (all time high $1160)
Chart #2: 2015-2017 (all time high $3000)
The analysis displayed in front of you is similar to my Siacoin prediction which was extremely successful (chart is shown below).
This is the reasoning behind the title "Rinse and Repeat x2".
Now back to the point, bitcoin... As you can see from charts #1 and #2 they both follow a similar cycle, although, years apart.
Many would call this structure a parabolic curve, however, I prefer the lows touching the curve.
Both moves start of from low to high and finish on higher high 3 at their all time high, from there a double test of support can be seen on both charts.
I'm expecting a move to support around $1800 as my first target, from there I will update my analysis.
With August 1st around the corner it will be interesting to see the future direction.
As always thank you for your support!

📈 Master the Art and Science of Trading: sixfigurecapital.com
相關出版品
免責聲明
這些資訊和出版物並非旨在提供,也不構成TradingView提供或認可的任何形式的財務、投資、交易或其他類型的建議或推薦。請閱讀使用條款以了解更多資訊。
📈 Master the Art and Science of Trading: sixfigurecapital.com
相關出版品
免責聲明
這些資訊和出版物並非旨在提供,也不構成TradingView提供或認可的任何形式的財務、投資、交易或其他類型的建議或推薦。請閱讀使用條款以了解更多資訊。