
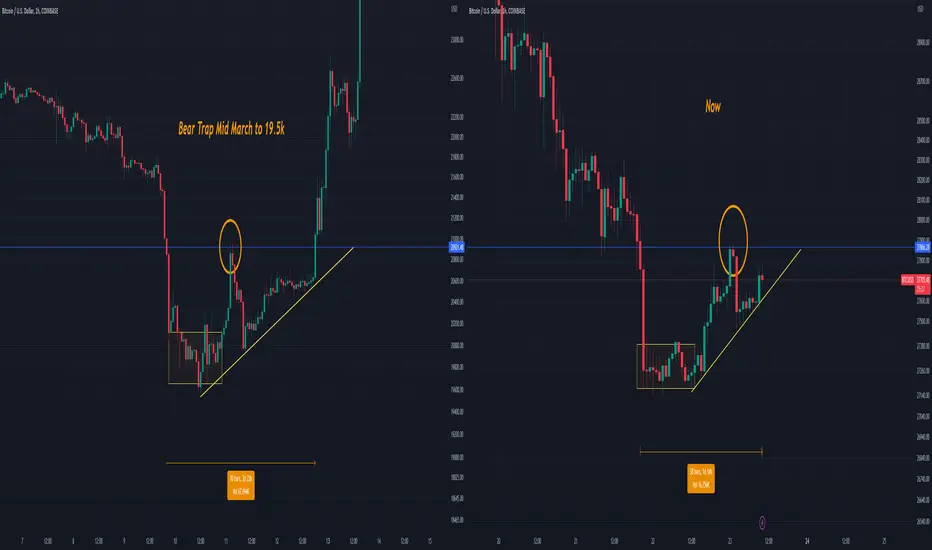
Interesting fractal appearing here on the 1hour , this is the same fractal that appeared when Bitcoin made that massive bear trap down to 19.5k.
This fractal appears in all timeframes and it is a bottoming fractal most of the time.
The higher the timeframe the bigger the move , this was the fractal that formed at 15-18k range.

Closing above the blue line within this pattern would be key here to long ,risky one no doubt.
This fractal appears in all timeframes and it is a bottoming fractal most of the time.
The higher the timeframe the bigger the move , this was the fractal that formed at 15-18k range.
Closing above the blue line within this pattern would be key here to long ,risky one no doubt.

免責聲明
這些資訊和出版物並非旨在提供,也不構成TradingView提供或認可的任何形式的財務、投資、交易或其他類型的建議或推薦。請閱讀使用條款以了解更多資訊。