
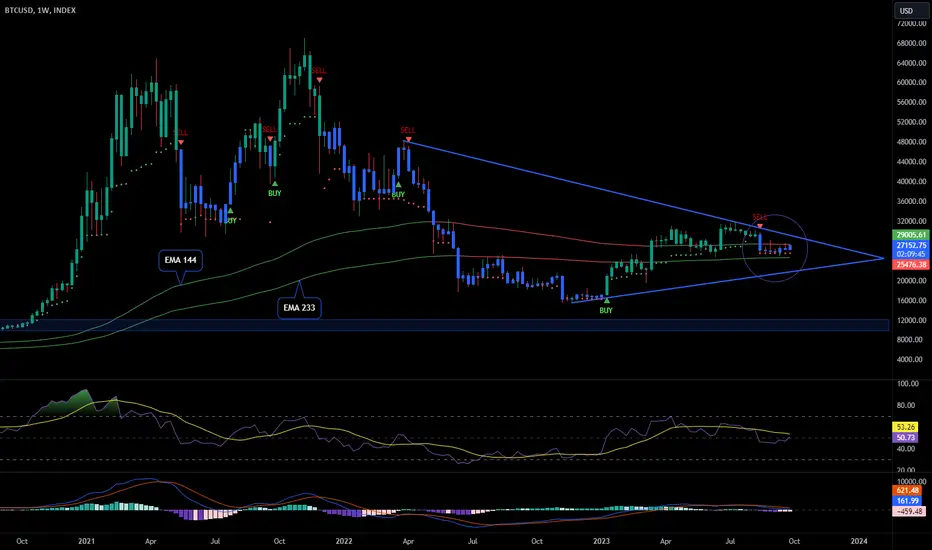
- Sell Signal Below Resistance Trend Line
- Squeeze between EMA 144 and 233
- RSI Picking Up
- MACD Neutral/Descending
Looking back to 2020 we can see a similar pattern.
What this mean?!?....
Well, it can repeat the same pattern that seems more sensible to me or in case of breaking the EMA 233 we will see a continuation of the downtrend towards the $10,000 region.
It was like this throughout September, squeeze between the two EMAs.
We will definitely have a lot of volatility this month and perhaps until the end of the year.
- Squeeze between EMA 144 and 233
- RSI Picking Up
- MACD Neutral/Descending
Looking back to 2020 we can see a similar pattern.
What this mean?!?....
Well, it can repeat the same pattern that seems more sensible to me or in case of breaking the EMA 233 we will see a continuation of the downtrend towards the $10,000 region.
It was like this throughout September, squeeze between the two EMAs.
We will definitely have a lot of volatility this month and perhaps until the end of the year.

免責聲明
這些資訊和出版物並非旨在提供,也不構成TradingView提供或認可的任何形式的財務、投資、交易或其他類型的建議或推薦。請閱讀使用條款以了解更多資訊。
免責聲明
這些資訊和出版物並非旨在提供,也不構成TradingView提供或認可的任何形式的財務、投資、交易或其他類型的建議或推薦。請閱讀使用條款以了解更多資訊。