My First Bitcoin Basic Technical Analysis
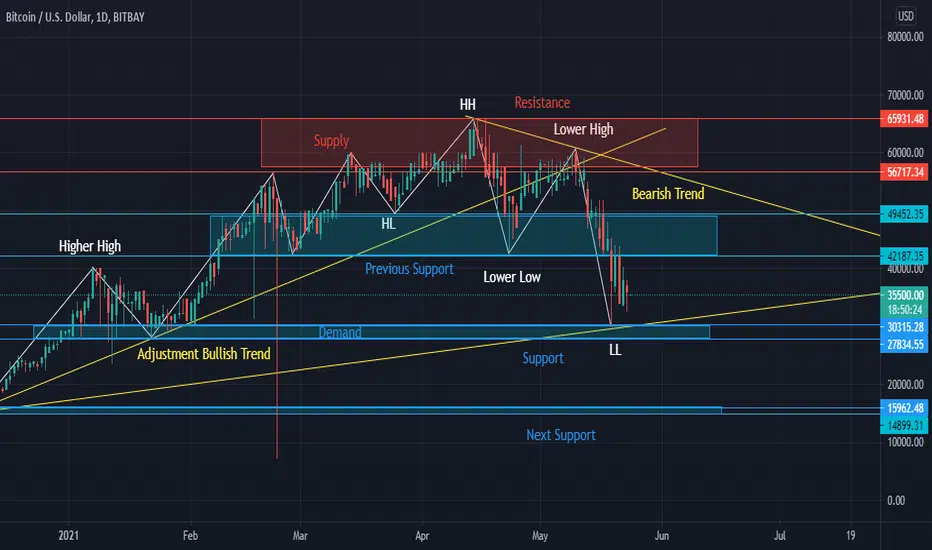
The 4 Basics:
1. Swing: in white line.
2. Trend: in yellow line.
3. Support & Resistance: Blue and Red lines.
4. Supply & Demand: in rectangles.
Summary:
The current trend is bearish after failing to break above $60000 and failing to maintain above $46000. A good buy opportunity between $28000 - $30000 especially if there is a rebound. However, a high probability of another market crash if the price drops below $28000 up to $16000 as the next support line.

免責聲明
這些資訊和出版物並非旨在提供,也不構成TradingView提供或認可的任何形式的財務、投資、交易或其他類型的建議或推薦。請閱讀使用條款以了解更多資訊。
免責聲明
這些資訊和出版物並非旨在提供,也不構成TradingView提供或認可的任何形式的財務、投資、交易或其他類型的建議或推薦。請閱讀使用條款以了解更多資訊。