
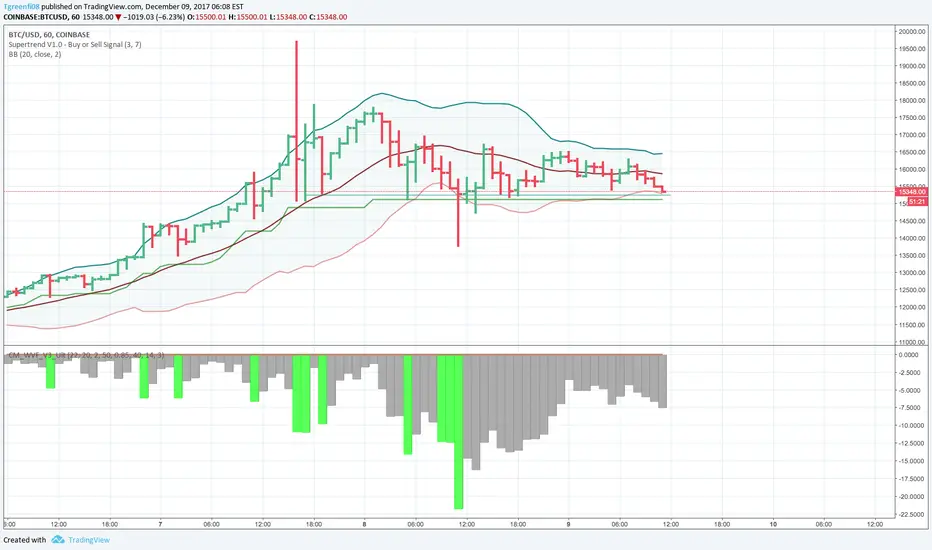
As a followup to my last post, this is another way to see if you're catching Bitcoin in a swing.
If the price is way above the Bollinger Bands, it's an indicator that you may want to sell, and buy it back at a lower price. Way below? This is a good indication that you may want to buy. Combine this with the CM_Williams_VIx_Fix_V3_Ultimate_Filtered_Alerts, and this can be another supportive indicator of whether the price is outside of the norm. With this indicator, it seems to me that both the thickness (multiple bars together) and/or length of the green bars are indicators of abnormal price activity.
See previous post for the fuller strategy.

免責聲明
這些資訊和出版物並非旨在提供,也不構成TradingView提供或認可的任何形式的財務、投資、交易或其他類型的建議或推薦。請閱讀使用條款以了解更多資訊。
免責聲明
這些資訊和出版物並非旨在提供,也不構成TradingView提供或認可的任何形式的財務、投資、交易或其他類型的建議或推薦。請閱讀使用條款以了解更多資訊。