
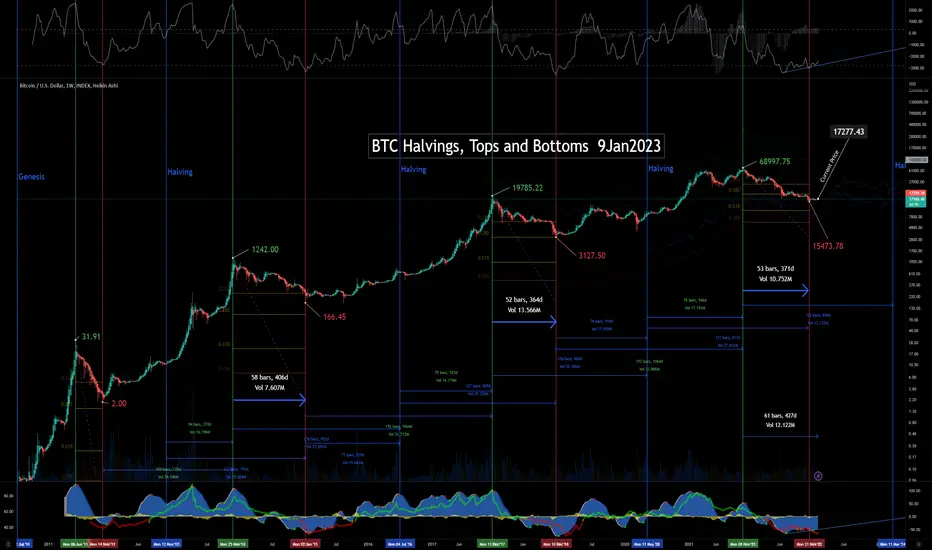
Latest update of an X-axis chart. Prices labeled for all cycle tops and bottoms. Dates marked for tops, bottoms and halvings.
Could easily see a 2x of previous ATH in 2025. Expecting slow trend upward with volatility increasing into the halving/ Fed pivot, then a parabolic 5-wave run up above 100k in 2025.
This version also includes time measurements of relevant cycle relationships.
Could easily see a 2x of previous ATH in 2025. Expecting slow trend upward with volatility increasing into the halving/ Fed pivot, then a parabolic 5-wave run up above 100k in 2025.
This version also includes time measurements of relevant cycle relationships.

免責聲明
這些資訊和出版物並非旨在提供,也不構成TradingView提供或認可的任何形式的財務、投資、交易或其他類型的建議或推薦。請閱讀使用條款以了解更多資訊。
免責聲明
這些資訊和出版物並非旨在提供,也不構成TradingView提供或認可的任何形式的財務、投資、交易或其他類型的建議或推薦。請閱讀使用條款以了解更多資訊。