
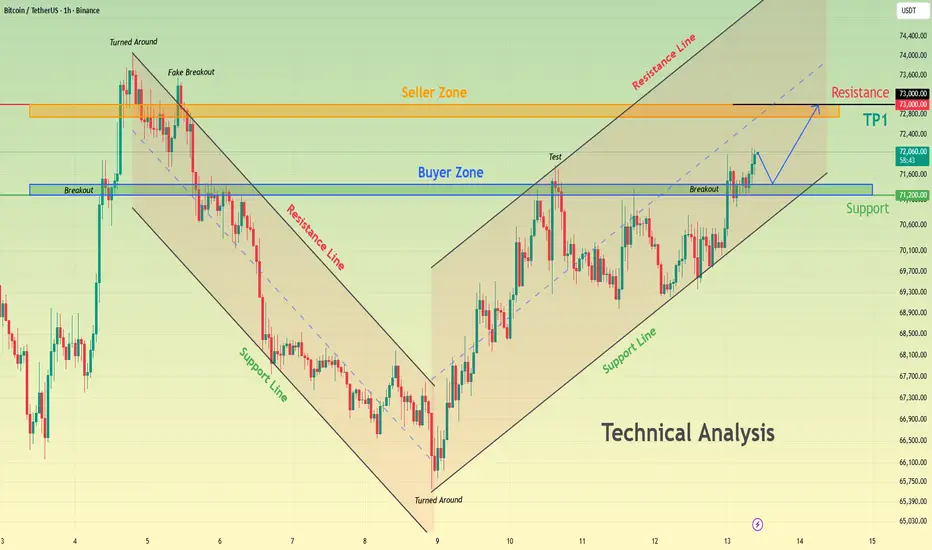
Hello traders! Here’s my technical outlook based on the current BTCUSDT (1H) chart structure. Price previously moved inside a descending channel, where sellers controlled the market and formed lower highs and lower lows. After reaching the lower boundary, BTC reversed sharply and started a recovery phase. The market then broke above the 71,200 resistance, confirming bullish momentum and shifting the short-term structure upward. Currently, price is retesting the 71,200 level, which now acts as a buyer zone, while continuing to move inside an ascending channel. As long as BTC holds above 71,200 support, the bullish bias remains intact. A continuation from this area could push price toward the 73,000 resistance (TP1), which aligns with the seller zone and the upper boundary of the channel. If price falls back below 71,200, a deeper pullback may occur. Please share this idea with your friends and click Boost 🚀
交易結束:目標達成
We can see that the analysis worked quite well. Buyers were able to push the price to our target where sellers had already intervened.
🔷Join my telegram channel for free - bit.ly/4g4wovR
💰Want receive more profitable signals for Crypto & Forex market, write me PM 👉 bit.ly/4fNijD8
💰Want receive more profitable signals for Crypto & Forex market, write me PM 👉 bit.ly/4fNijD8
免責聲明
這些資訊和出版物並非旨在提供,也不構成TradingView提供或認可的任何形式的財務、投資、交易或其他類型的建議或推薦。請閱讀使用條款以了解更多資訊。
🔷Join my telegram channel for free - bit.ly/4g4wovR
💰Want receive more profitable signals for Crypto & Forex market, write me PM 👉 bit.ly/4fNijD8
💰Want receive more profitable signals for Crypto & Forex market, write me PM 👉 bit.ly/4fNijD8
免責聲明
這些資訊和出版物並非旨在提供,也不構成TradingView提供或認可的任何形式的財務、投資、交易或其他類型的建議或推薦。請閱讀使用條款以了解更多資訊。