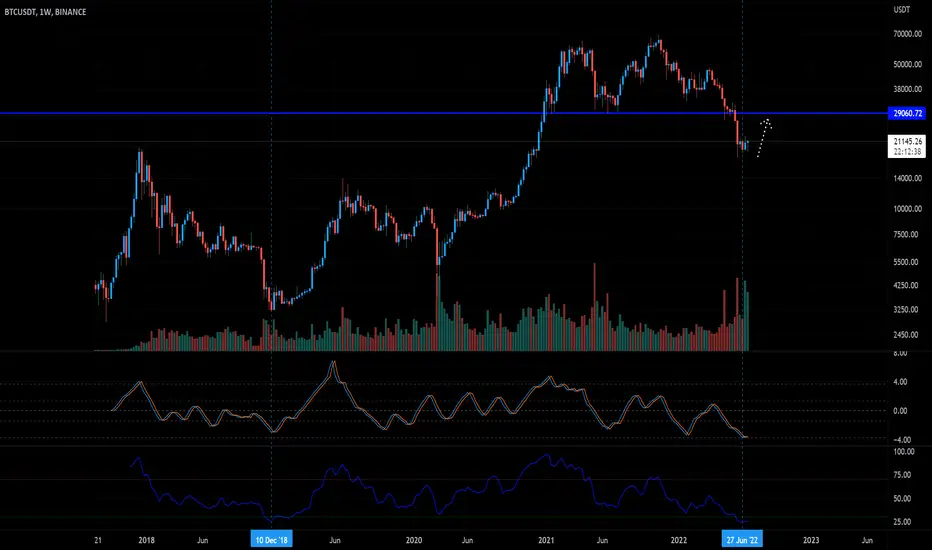
I'm thinking we see a retest of the previous support region around 29-30k before BTC attempts any further downward attempts
The weekly RSI here showing we are at a similar level to the 2018-19 bottom, Could we see an unexpected bullish swing upwards? Fisher indicator also showing signs of a reversal (crossing up)
Interesting point for BTC to be, time will tell.

 BTCUSDTBTCUSDBTCUSDBTCUSD
註釋
There's a cheeky bullish harmonic on the weekly too註釋
just look at the volume on the last green 2-week, higher than the dump candles, indicates reversal (just looking at volume)and you have the massive 2-weekly bullish harmonic that everyone seems to be ignoring.. these harmonics play out on almost all TF's.. it's extremely rare to get one on a high TF like the 2-week
註釋
Related charts are scattered throughout this idea:
註釋
Looking stronger on the chance of the bullish reversal harmonic playing out!註釋
closed 2-week above S2 which was an issue for a while註釋
Still chilling around here for now, no sign of invalidation yet which is good

免責聲明
這些資訊和出版物並非旨在提供,也不構成TradingView提供或認可的任何形式的財務、投資、交易或其他類型的建議或推薦。請閱讀使用條款以了解更多資訊。