
Hello?
Dear traders, nice to meet you.
"Like" is a huge force for me.
By "following" you can always get new information quickly.
Thank you for always supporting me.
-------------------------------------------------- -----
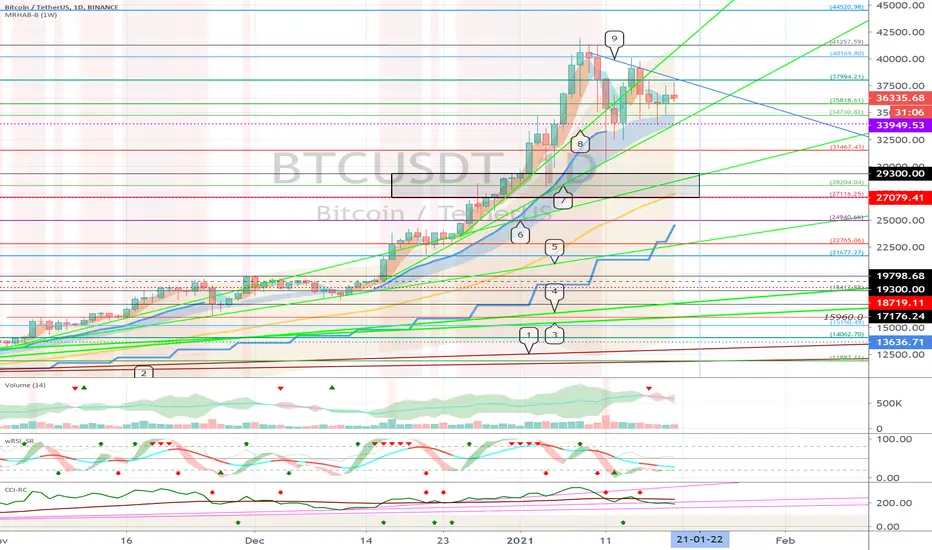
We have to see if we can get support at 35818.61 and climb above 37994.21.
If it falls at 33949.53, you need a Stop Loss to preserve profit or loss.
If you touch the 27079.41-29300.0 section, I think there is a high possibility of turning into a downtrend.
So, you have to think about how to deal with it in the 29300.0 -33949.53 section.
-------------------------------------------------- -
(OKEX BTCUSDT 1D chart)

You should watch for any movement that deviates from the 35490.7-37645.3 segment.
If you go down at 34559.3, you can touch 31577.0, so it's a short stop loss.
If you touch the 28165.8-29309.0 section, I think there is a high possibility of turning into a downtrend.
So, you have to think about how to deal with it in the 29309.0 -34559.3 interval.
-------------------------------------------------- -
(Coinbase BTCUSD 1D chart)

We need to see if we can get support at 35890.94 and climb above 38072.66.
If it declines at 34030.64, a Stop Loss is needed to preserve profit and loss.
If you touch the 27040.36-29321.90 section, I think there is a high possibility of turning into a downtrend.
So, you have to think about how to deal with it in the 29321.90-34030.64 section.
-------------------------------------------------- -
(BTC Dominance 1D Chart)

We'll see if we can get resistance at 65.89 and move down.
--------------------------------------------------
(USDT Dominance 1D Chart)

It remains to be seen if it can move below the 2.349 point.
You should also watch for any movement that deviates from 2.187-2.541.
-------------------------------------------------- -------------------------------------------
** All indicators are lagging indicators.
So, it's important to know that the indicator moves accordingly with the movement of price and volume.
Just for convenience, we are talking upside down for interpretation of the indicators.
** The wRSI_SR indicator is an indicator created by adding settings and options from the existing Stochastic RSI indicator.
Hence, the interpretation is the same as the conventional Stochastic RSI indicator. (K, D line -> R, S line)
** The OBV indicator was re-created by applying a formula from the DepthHouse Trading indicator, an indicator that oh92 disclosed. (Thank you for this.)
** Check support, resistance, and abbreviation points.
** Support or resistance is based on the closing price of the 1D chart.
** All explanations are for reference only and do not guarantee profit or loss on investment.
Explanation of abbreviations displayed on the chart
R: A point or section of resistance that requires a response to preserve profits
S-L: Stop Loss point or section
S: A point or segment that can be bought for profit generation as a support point or segment
(Short-term Stop Loss can be said to be a point where profits or losses can be preserved or additionally entered through installment transactions. It is a short-term investment perspective.)
GAP refers to the difference in prices that occurred when the stock market, CME, and BAKKT exchanges were closed because they do not trade 24 hours a day.
G1: Closed price
G2: Market price at the time of opening
(Example) Gap (G1-G2)
Dear traders, nice to meet you.
"Like" is a huge force for me.
By "following" you can always get new information quickly.
Thank you for always supporting me.
-------------------------------------------------- -----
We have to see if we can get support at 35818.61 and climb above 37994.21.
If it falls at 33949.53, you need a Stop Loss to preserve profit or loss.
If you touch the 27079.41-29300.0 section, I think there is a high possibility of turning into a downtrend.
So, you have to think about how to deal with it in the 29300.0 -33949.53 section.
-------------------------------------------------- -
(OKEX BTCUSDT 1D chart)
You should watch for any movement that deviates from the 35490.7-37645.3 segment.
If you go down at 34559.3, you can touch 31577.0, so it's a short stop loss.
If you touch the 28165.8-29309.0 section, I think there is a high possibility of turning into a downtrend.
So, you have to think about how to deal with it in the 29309.0 -34559.3 interval.
-------------------------------------------------- -
(Coinbase BTCUSD 1D chart)
We need to see if we can get support at 35890.94 and climb above 38072.66.
If it declines at 34030.64, a Stop Loss is needed to preserve profit and loss.
If you touch the 27040.36-29321.90 section, I think there is a high possibility of turning into a downtrend.
So, you have to think about how to deal with it in the 29321.90-34030.64 section.
-------------------------------------------------- -
(BTC Dominance 1D Chart)
We'll see if we can get resistance at 65.89 and move down.
--------------------------------------------------
(USDT Dominance 1D Chart)
It remains to be seen if it can move below the 2.349 point.
You should also watch for any movement that deviates from 2.187-2.541.
-------------------------------------------------- -------------------------------------------
** All indicators are lagging indicators.
So, it's important to know that the indicator moves accordingly with the movement of price and volume.
Just for convenience, we are talking upside down for interpretation of the indicators.
** The wRSI_SR indicator is an indicator created by adding settings and options from the existing Stochastic RSI indicator.
Hence, the interpretation is the same as the conventional Stochastic RSI indicator. (K, D line -> R, S line)
** The OBV indicator was re-created by applying a formula from the DepthHouse Trading indicator, an indicator that oh92 disclosed. (Thank you for this.)
** Check support, resistance, and abbreviation points.
** Support or resistance is based on the closing price of the 1D chart.
** All explanations are for reference only and do not guarantee profit or loss on investment.
Explanation of abbreviations displayed on the chart
R: A point or section of resistance that requires a response to preserve profits
S-L: Stop Loss point or section
S: A point or segment that can be bought for profit generation as a support point or segment
(Short-term Stop Loss can be said to be a point where profits or losses can be preserved or additionally entered through installment transactions. It is a short-term investment perspective.)
GAP refers to the difference in prices that occurred when the stock market, CME, and BAKKT exchanges were closed because they do not trade 24 hours a day.
G1: Closed price
G2: Market price at the time of opening
(Example) Gap (G1-G2)
註釋
We have to watch how much altcoin price will rise amid the boring sideways in BTC price.In addition, if altcoins prices rise sharply, then BTC price movement is expected to become active.
It is not expected that it will take long.
Don't think that the BTC price fluctuations will necessarily rise, always be prepared for a decline and enjoy the altcoin bull market.

YouTube: youtube.com/@readcrypto9837
※ Follow X to check out the posts.
※ X를 팔로우하고 게시물을 확인하세요.
◆ t.me/readCryptoChannel
[HA-MS Indicator]
bit.ly/3YxHgvN
[OBV Indicator]
bit.ly/4dcyny3
※ Follow X to check out the posts.
※ X를 팔로우하고 게시물을 확인하세요.
◆ t.me/readCryptoChannel
[HA-MS Indicator]
bit.ly/3YxHgvN
[OBV Indicator]
bit.ly/4dcyny3
相關出版品
免責聲明
這些資訊和出版物並非旨在提供,也不構成TradingView提供或認可的任何形式的財務、投資、交易或其他類型的建議或推薦。請閱讀使用條款以了解更多資訊。
YouTube: youtube.com/@readcrypto9837
※ Follow X to check out the posts.
※ X를 팔로우하고 게시물을 확인하세요.
◆ t.me/readCryptoChannel
[HA-MS Indicator]
bit.ly/3YxHgvN
[OBV Indicator]
bit.ly/4dcyny3
※ Follow X to check out the posts.
※ X를 팔로우하고 게시물을 확인하세요.
◆ t.me/readCryptoChannel
[HA-MS Indicator]
bit.ly/3YxHgvN
[OBV Indicator]
bit.ly/4dcyny3
相關出版品
免責聲明
這些資訊和出版物並非旨在提供,也不構成TradingView提供或認可的任何形式的財務、投資、交易或其他類型的建議或推薦。請閱讀使用條款以了解更多資訊。