
Hello and a warm welcome to this analysis on BTCUSDT
On daily time frame we can see
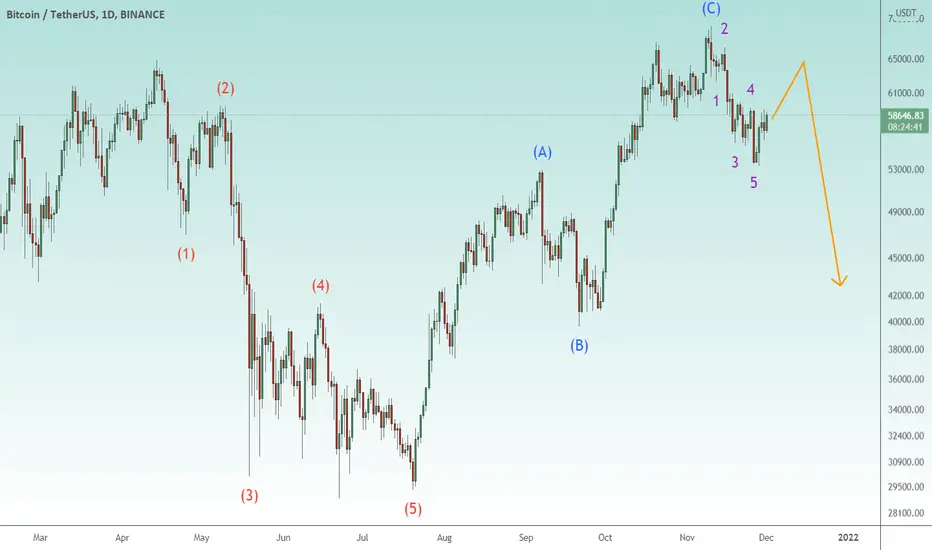
5 waves down - Wave A from APRIL 2021 to JULY 2021
followed by
Corrective abc up - Wave B from JULY 2021 to NOV 2021 which looks like a double top/horizontal B
then another
Minute impulse down - Wave 1 of C
currently it appears to be making Wave 2 of C which could retrace till 62000-64000 to be followed by Wave 3 of C down till approx 43000.
The view would be invalid if it prints a new high.
Short on rallies accordingly.
On daily time frame we can see
5 waves down - Wave A from APRIL 2021 to JULY 2021
followed by
Corrective abc up - Wave B from JULY 2021 to NOV 2021 which looks like a double top/horizontal B
then another
Minute impulse down - Wave 1 of C
currently it appears to be making Wave 2 of C which could retrace till 62000-64000 to be followed by Wave 3 of C down till approx 43000.
The view would be invalid if it prints a new high.
Short on rallies accordingly.

免責聲明
這些資訊和出版物並非旨在提供,也不構成TradingView提供或認可的任何形式的財務、投資、交易或其他類型的建議或推薦。請閱讀使用條款以了解更多資訊。
免責聲明
這些資訊和出版物並非旨在提供,也不構成TradingView提供或認可的任何形式的財務、投資、交易或其他類型的建議或推薦。請閱讀使用條款以了解更多資訊。