
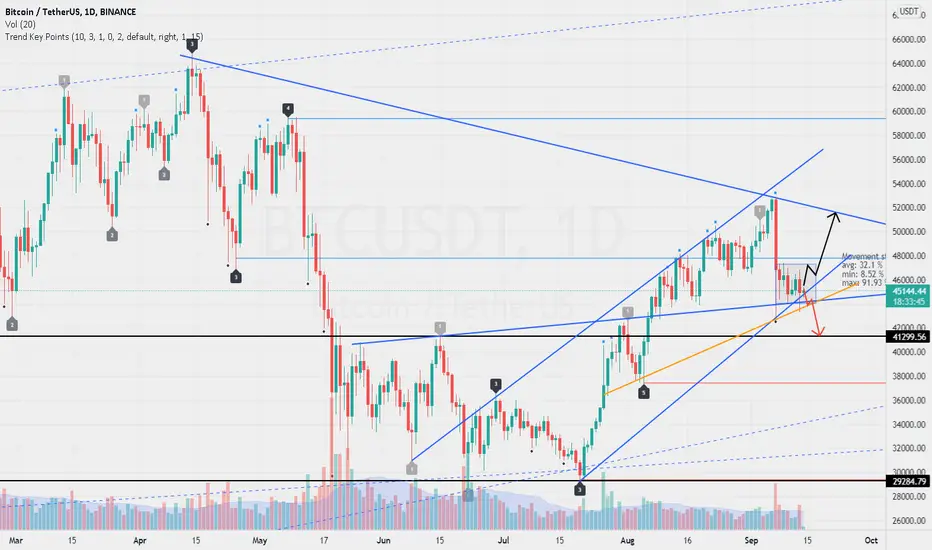
$44k is the most important support near. Its breakdown could pull the price around $41k.
The rectangle is drawn on the 1-hour time frame, I expect it to break upwards with a resistance. If so, the next stop will be between $50k and $51k.
Trend Key Points Indicator have been used to draw important key levels and key points.
The rectangle is drawn on the 1-hour time frame, I expect it to break upwards with a resistance. If so, the next stop will be between $50k and $51k.
Trend Key Points Indicator have been used to draw important key levels and key points.

免責聲明
這些資訊和出版物並非旨在提供,也不構成TradingView提供或認可的任何形式的財務、投資、交易或其他類型的建議或推薦。請閱讀使用條款以了解更多資訊。