
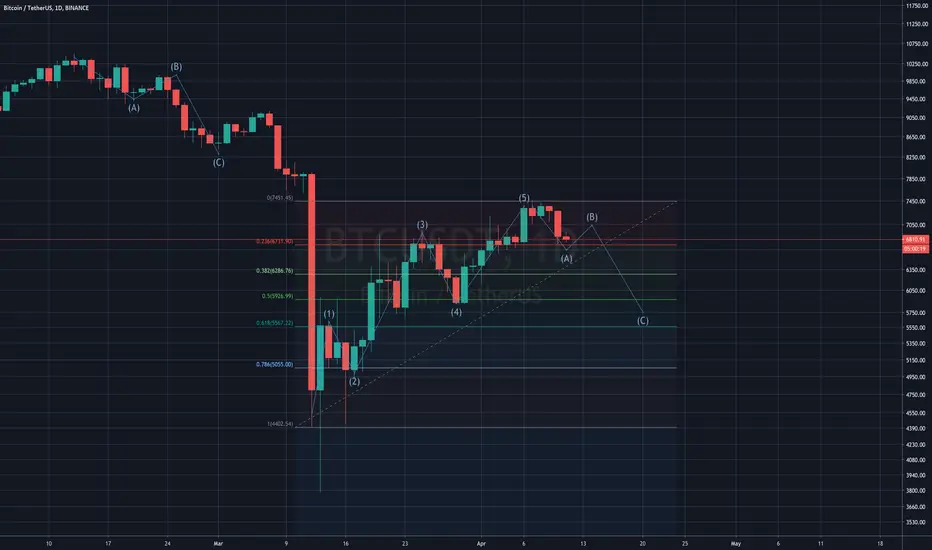
For me, the possible movements of the trend with the application of Elliott's rules are those of the graph. Bitcoins have not broken the resistance at 7,400k USD, by interpolating Elliot's main wave of impulse (Step 5). So now the price follows the waves (ABC) and now it's on (A). The Elliott wave indicates a possible path and price levels, which corresponds exactly to the Fibo graph plotted on the beginning of the pulse wave. Hence it is desirable that in case of bearish the price will go to 6.3 and 5.8k USD. Probably in the next few days.
#surfthetrend
#surfthetrend
交易進行
Bull Trap... 交易進行
Target (B) Reached, Now let's see what happens.交易進行
Wave B: Reached交易進行
Corrective and ZigZag into (Master Waves section (A-B)交易進行
Bearish Divergences 交易進行
H&S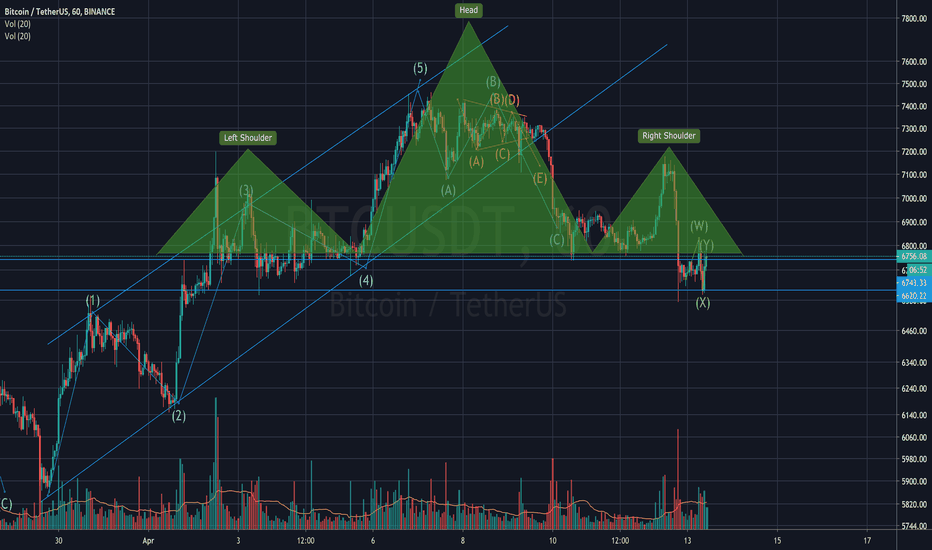
交易進行
Hidden divergence has preannunciament this movement 註釋
Wave + Correction Triangle, Top Flat, Bottom rising.
相關出版品
免責聲明
這些資訊和出版物並非旨在提供,也不構成TradingView提供或認可的任何形式的財務、投資、交易或其他類型的建議或推薦。請閱讀使用條款以了解更多資訊。