
Here I tried to show everything as simpliest as possible.
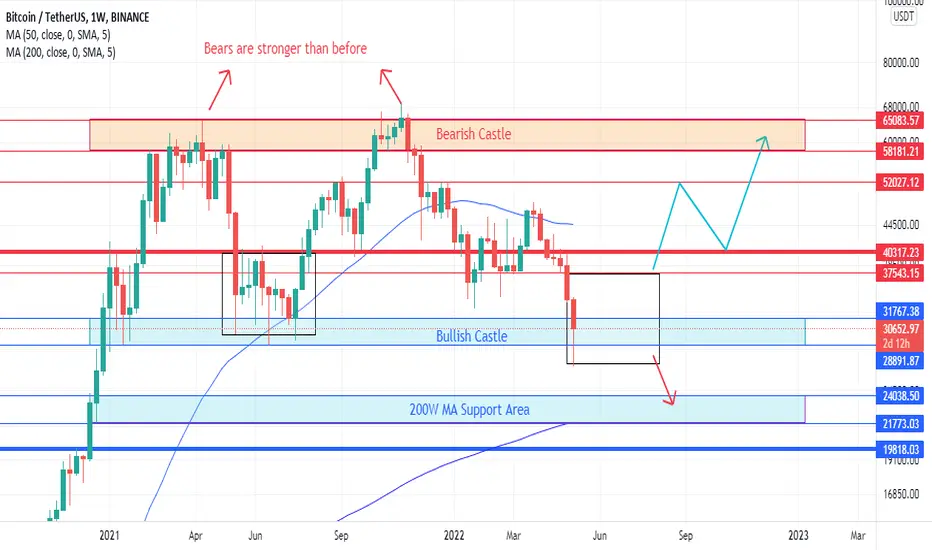
As you can see from the graph, blue lines are our support areas while the red ones are the resistances. Black boxes are the accumulation zones.
Like I written on the graph, we can see that "Bears are stronger" or "Bulls are getting weaker against to Bears" since the price rejection was faster than before when the BTC came to the area 58-65 for the second time.
I believe BTC will accumulate inside the black box for a while like it did last summer. Than, it is important to see which direction it will break. If it can break upward, 37.5-40 k area, I believe price will try the 58-65 k area again. Otherwise, if it breaks downward direction, than it can fall down until the Weekly 200 MA Support area.
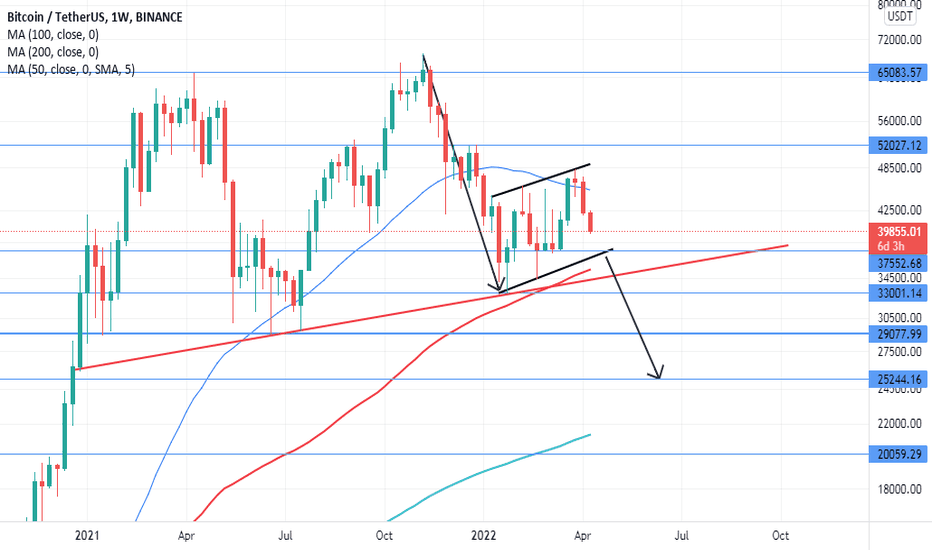
You can see my old idea below:
This is not a financial advice. This is just my analysis trial.
As you can see from the graph, blue lines are our support areas while the red ones are the resistances. Black boxes are the accumulation zones.
Like I written on the graph, we can see that "Bears are stronger" or "Bulls are getting weaker against to Bears" since the price rejection was faster than before when the BTC came to the area 58-65 for the second time.
I believe BTC will accumulate inside the black box for a while like it did last summer. Than, it is important to see which direction it will break. If it can break upward, 37.5-40 k area, I believe price will try the 58-65 k area again. Otherwise, if it breaks downward direction, than it can fall down until the Weekly 200 MA Support area.
You can see my old idea below:
This is not a financial advice. This is just my analysis trial.

免責聲明
這些資訊和出版物並非旨在提供,也不構成TradingView提供或認可的任何形式的財務、投資、交易或其他類型的建議或推薦。請閱讀使用條款以了解更多資訊。