
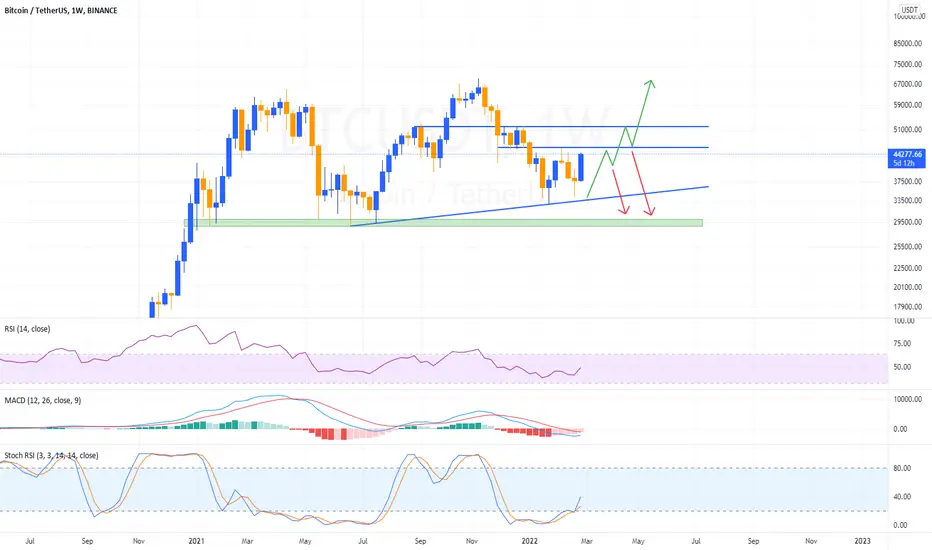
Bitcoin has been showing big volatility last two month becuase of FED interest speculation and Russia vs Ukraine crisis. But weekly chart still bullish and indicates BTC can have a big rally in next 12-16 weeks. RSI showing bullish divergence, MACD showing low sell pressure like June 20221 and stock RSI indicate market can give bounce with short term noise.
First resistance on W1 chart is $45k then $53k while support is at $36k and $29k.
Try to understand chart and trade between the lines.
Major events: Russia/Ukraine and FED interest speculation.
Trade safely :)
First resistance on W1 chart is $45k then $53k while support is at $36k and $29k.
Try to understand chart and trade between the lines.
Major events: Russia/Ukraine and FED interest speculation.
Trade safely :)

免責聲明
這些資訊和出版物並非旨在提供,也不構成TradingView提供或認可的任何形式的財務、投資、交易或其他類型的建議或推薦。請閱讀使用條款以了解更多資訊。
免責聲明
這些資訊和出版物並非旨在提供,也不構成TradingView提供或認可的任何形式的財務、投資、交易或其他類型的建議或推薦。請閱讀使用條款以了解更多資訊。