
BTC/USD
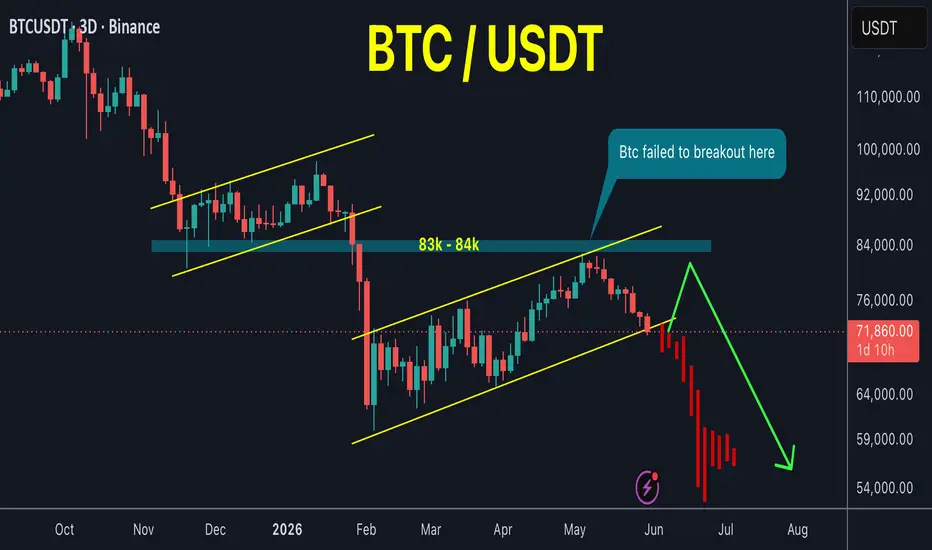
Bitcoin's price has formed another bearish flag pattern similar to the previous one.
Bitcoin has been trading within this bearish pattern for four months, and a break below it would likely lead to a price drop to a previous low or lower.
Since the top in October , the price appears to have failed to make any bullish break out, suggesting that Bitcoin will continue to decline more sooner or later until there is real trend shift in market structure
Scenario 1 and 2 both bearish now in my chart
Bitcoin's price has formed another bearish flag pattern similar to the previous one.
Bitcoin has been trading within this bearish pattern for four months, and a break below it would likely lead to a price drop to a previous low or lower.
Since the top in October , the price appears to have failed to make any bullish break out, suggesting that Bitcoin will continue to decline more sooner or later until there is real trend shift in market structure
Scenario 1 and 2 both bearish now in my chart
交易進行
BTC just hit 68k ☑️交易結束:目標達成
The price dropped sharply a few hours after my analysis. 註釋
Update :註釋
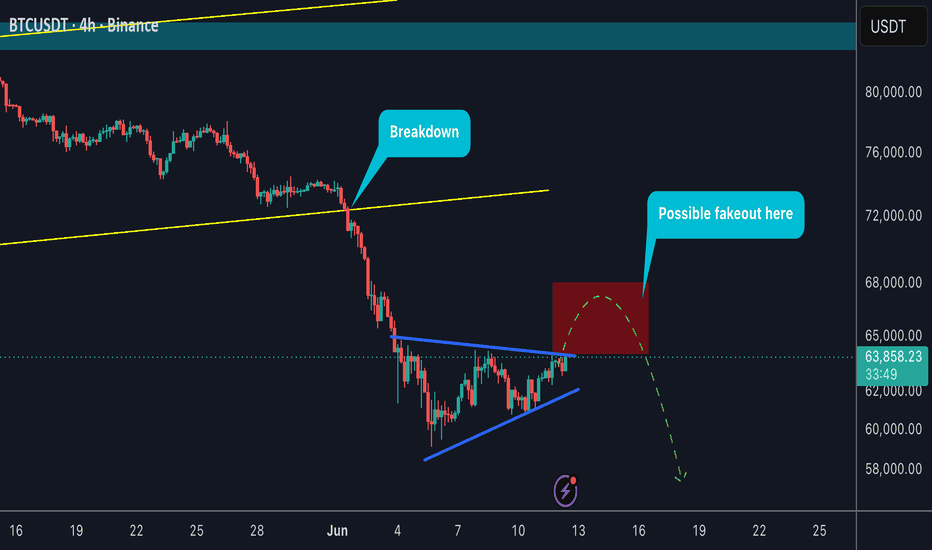
Bitcoin reached $60,000 for the first time after four months of accumulation within this bearish pattern, as I predicted in my analysis.註釋
New update released For full details Check here : 👇

🔷 Telegram channel: t.me/bitcoin_masters
💸☎️ For Premium Signals Group ask me here: t.me/Babenski
💸☎️ For Premium Signals Group ask me here: t.me/Babenski
相關出版品
免責聲明
這些資訊和出版物並非旨在提供,也不構成TradingView提供或認可的任何形式的財務、投資、交易或其他類型的建議或推薦。請閱讀使用條款以了解更多資訊。
🔷 Telegram channel: t.me/bitcoin_masters
💸☎️ For Premium Signals Group ask me here: t.me/Babenski
💸☎️ For Premium Signals Group ask me here: t.me/Babenski
相關出版品
免責聲明
這些資訊和出版物並非旨在提供,也不構成TradingView提供或認可的任何形式的財務、投資、交易或其他類型的建議或推薦。請閱讀使用條款以了解更多資訊。