
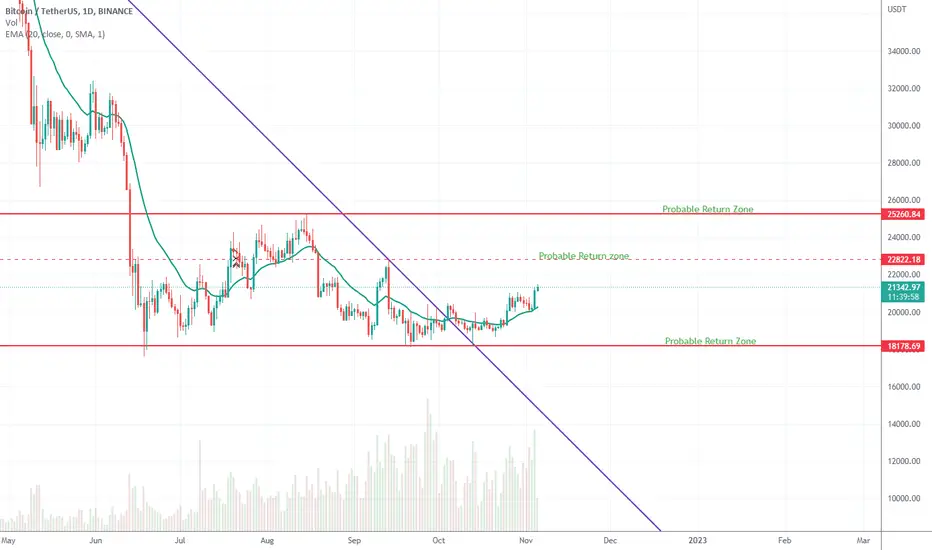
As you see in the chart, there is a purple bearish trend line and there are 3 red horizontal lines.
The Purple trendline is based on two pivots on days of 30th of March and 10th of November. And the red horizontal lines indicate top and bottom of Trading range that has been made in the past few weeks and the dotted one is showing top of the smaller trading range inside the big one.
I am noticing the first sign of the trend reversal in btc, and that is it has broken the purple trendline and after a nice pullback, has started to rise up.
I am expecting btc to continue to rise in the following days and see two major Resistance up on it's way, which are the two tops of the past trading range.

免責聲明
這些資訊和出版物並非旨在提供,也不構成TradingView提供或認可的任何形式的財務、投資、交易或其他類型的建議或推薦。請閱讀使用條款以了解更多資訊。
免責聲明
這些資訊和出版物並非旨在提供,也不構成TradingView提供或認可的任何形式的財務、投資、交易或其他類型的建議或推薦。請閱讀使用條款以了解更多資訊。