Before diving into the 4-hour Bitcoin(
 BTCUSDT) chart, let’s quickly run through the fundamental analysis.
Please stay with me
Bitcoin Fundamental & News:
1. U.S.–Iran Roadmap Agreement — The Main Macro Catalyst
The most important development was the reported agreement between the U.S. and Iran on a roadmap toward a final deal within the next 60 days.
This reduced geopolitical risk significantly, with the Strait of Hormuz expected to remain open and oil prices falling below $80. Lower oil prices are generally positive for global inflation expectations and risk assets.
Asian equities and traditional markets reacted positively, but Bitcoin showed a classic “buy the rumor, sell the news” reaction. BTC initially spiked above $67,000 on the rumor, but after the official confirmation, it rejected and dropped back toward the $64,000 area.
2. Continued Outflows From Bitcoin ETFs
The second major bearish factor remains the persistent outflow from spot Bitcoin ETFs.
Bitcoin ETFs reportedly recorded their sixth consecutive week of outflows, with around $227 million leaving the market between June 14 and June 18 alone.
Overall, June has been a weak month for institutional flows, and these ETF outflows remain one of the main reasons Bitcoin has struggled to hold higher levels despite positive macro headlines.
3. Other Important Bitcoin Developments
On-chain activity is starting to improve, according to CryptoQuant, which may suggest that selling pressure is gradually weakening and accumulation is slowly returning.
Franklin Templeton also filed for a new Bitcoin-related DRIP ETF structure, designed to reinvest dividend income into BTC exposure.
Meanwhile, Bitcoin developers continue to discuss improvements around RBF, or Replace-by-Fee, which could improve transaction flexibility and fee management on the network.
----------
Now, let’s get into the technical analysis on the 4-hour timeframe.
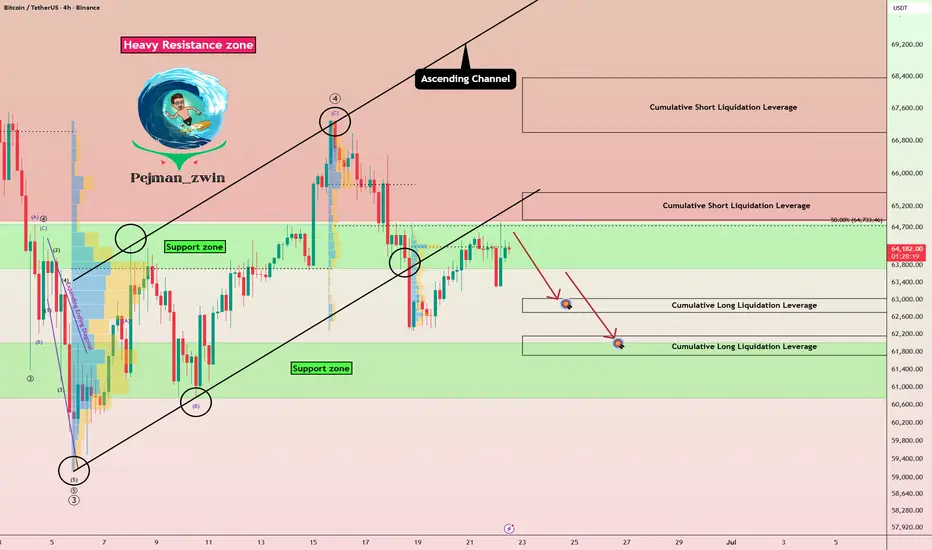
Currently, Bitcoin seems to have broken the support zone($64,760-$63,720) and the lower line of the ascending channel, and is now completing a pullback toward these levels.
From an Elliott Wave perspective, this suggests that main wave 4 might have completed after breaking the lower line of the ascending channel, and we could anticipate further downside in the coming days.
Additionally, with the DXY Index( DXY) and U.S. 10-Year Government Bond Yield(
 US10) both on upward trends, and considering the likelihood of a bearish S&P 500(
 SPX500), these factors could all support further downward pressure on Bitcoin in the short term.
I expect Bitcoin, in the coming hours, to potentially drop toward the Cumulative Long Liquidation Leverage($63,020-$62,700). Bearish momentum is strong; we might even see a test of the support zone($62,000-$60,750).
Cumulative Long Liquidation Leverage: $62,160-$61,720
Cumulative Short Liquidation Leverage: $68,3700-$67,000
Cumulative Short Liquidation Leverage: $65,530-$64,880
What do you think about Bitcoin? Will it drop below $60,000, or not?
💡 Please respect each other's opinions and express agreement or disagreement politely.
📌Bitcoin Analysis (BTCUSDT), 4-hour time frame.
🛑 Always set a Stop Loss(SL) for every position you open.
✅ This is just my idea; I’d love to see your thoughts too!
🔥If you find it helpful, please BOOST this post and share it with your friends.
BTCUSDT) chart, let’s quickly run through the fundamental analysis.Please stay with me
Bitcoin Fundamental & News:
1. U.S.–Iran Roadmap Agreement — The Main Macro Catalyst
The most important development was the reported agreement between the U.S. and Iran on a roadmap toward a final deal within the next 60 days.
This reduced geopolitical risk significantly, with the Strait of Hormuz expected to remain open and oil prices falling below $80. Lower oil prices are generally positive for global inflation expectations and risk assets.
Asian equities and traditional markets reacted positively, but Bitcoin showed a classic “buy the rumor, sell the news” reaction. BTC initially spiked above $67,000 on the rumor, but after the official confirmation, it rejected and dropped back toward the $64,000 area.
2. Continued Outflows From Bitcoin ETFs
The second major bearish factor remains the persistent outflow from spot Bitcoin ETFs.
Bitcoin ETFs reportedly recorded their sixth consecutive week of outflows, with around $227 million leaving the market between June 14 and June 18 alone.
Overall, June has been a weak month for institutional flows, and these ETF outflows remain one of the main reasons Bitcoin has struggled to hold higher levels despite positive macro headlines.
3. Other Important Bitcoin Developments
On-chain activity is starting to improve, according to CryptoQuant, which may suggest that selling pressure is gradually weakening and accumulation is slowly returning.
Franklin Templeton also filed for a new Bitcoin-related DRIP ETF structure, designed to reinvest dividend income into BTC exposure.
Meanwhile, Bitcoin developers continue to discuss improvements around RBF, or Replace-by-Fee, which could improve transaction flexibility and fee management on the network.
----------
Now, let’s get into the technical analysis on the 4-hour timeframe.
Currently, Bitcoin seems to have broken the support zone($64,760-$63,720) and the lower line of the ascending channel, and is now completing a pullback toward these levels.
From an Elliott Wave perspective, this suggests that main wave 4 might have completed after breaking the lower line of the ascending channel, and we could anticipate further downside in the coming days.
Additionally, with the DXY Index(
DXY) and U.S. 10-Year Government Bond Yield(US10) both on upward trends, and considering the likelihood of a bearish S&P 500(SPX500), these factors could all support further downward pressure on Bitcoin in the short term.I expect Bitcoin, in the coming hours, to potentially drop toward the Cumulative Long Liquidation Leverage($63,020-$62,700). Bearish momentum is strong; we might even see a test of the support zone($62,000-$60,750).
Cumulative Long Liquidation Leverage: $62,160-$61,720
Cumulative Short Liquidation Leverage: $68,3700-$67,000
Cumulative Short Liquidation Leverage: $65,530-$64,880
What do you think about Bitcoin? Will it drop below $60,000, or not?
💡 Please respect each other's opinions and express agreement or disagreement politely.
📌Bitcoin Analysis (BTCUSDT), 4-hour time frame.
🛑 Always set a Stop Loss(SL) for every position you open.
✅ This is just my idea; I’d love to see your thoughts too!
🔥If you find it helpful, please BOOST this post and share it with your friends.
交易進行
Short position was activated.
💡Bitcoin, over the past few months, has been strongly influenced by the U.S. stock market, particularly the S&P 500. Whenever the S&P makes high momentum moves, Bitcoin’s correlation with it increases, leading to similar patterns. Right now, as we approach U.S. market open, we’ve seen a lot of noise on Bitcoin’s chart in recent months—not respecting support/resistance areas and often producing bull or bear traps—basically, fake breakouts.
Given the potential for the S&P 500 to drop again in the coming hours, Bitcoin may also continue its decline. The recent 3-4 hours of upward movement didn’t come with strong volume, so a further drop is possible. The area Bitcoin is at was a Potential Reversal Zone(PRZ)[$65,810-$65,320] just above support zone($64,760-$63,720). If Bitcoin breaks below 64,000, we could expect further downside. But overall, remember to practice proper risk management. Let’s see where it goes!
交易結束:目標達成
Full Target Done

🚀 Up to 75% Trading Fee Rebates Across 20+ Exchanges:
🤖 t.me/Protrader365bot
-----
🎁 Free VIP Forex and Crypto Signals, please visit:
🔗 t.me/ProTrader_365
🤖 t.me/Protrader365bot
-----
🎁 Free VIP Forex and Crypto Signals, please visit:
🔗 t.me/ProTrader_365
免責聲明
這些資訊和出版物並非旨在提供,也不構成TradingView提供或認可的任何形式的財務、投資、交易或其他類型的建議或推薦。請閱讀使用條款以了解更多資訊。
🚀 Up to 75% Trading Fee Rebates Across 20+ Exchanges:
🤖 t.me/Protrader365bot
-----
🎁 Free VIP Forex and Crypto Signals, please visit:
🔗 t.me/ProTrader_365
🤖 t.me/Protrader365bot
-----
🎁 Free VIP Forex and Crypto Signals, please visit:
🔗 t.me/ProTrader_365
免責聲明
這些資訊和出版物並非旨在提供,也不構成TradingView提供或認可的任何形式的財務、投資、交易或其他類型的建議或推薦。請閱讀使用條款以了解更多資訊。