
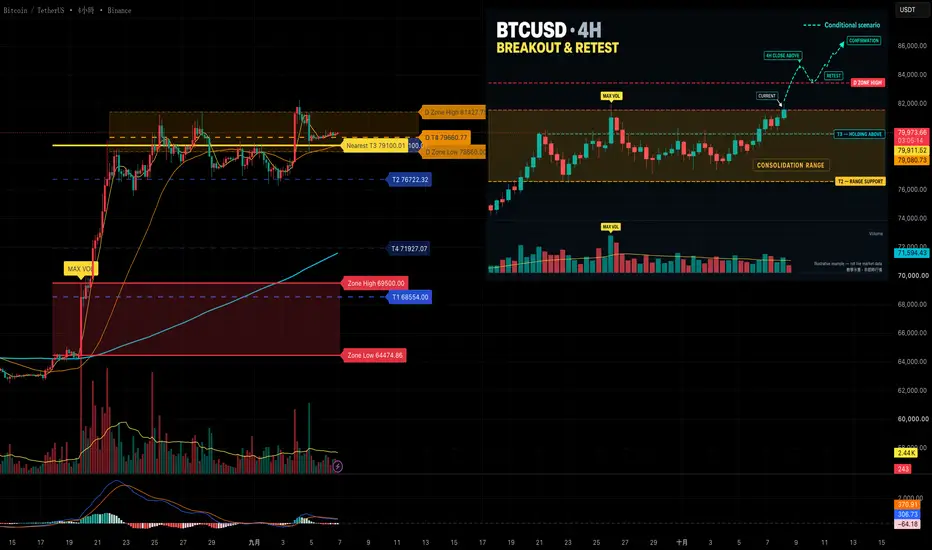
This HOW-TO explains how to read a BTCUSDT 4-hour consolidation structure using Volume Structure Navigator Promax.
1. Current Structure
BTCUSD is currently shown consolidating between T2 and D Zone High.
T2 represents the lower structural support of the range, while D Zone High remains the upper boundary that price has not yet confirmed as broken.
Recent candles have moved above T3 and are beginning to hold above this level. This indicates an improvement in the short-term structure, but it does not yet confirm a complete breakout from the consolidation range.
2. Breakout Condition
A wick above D Zone High alone is not sufficient confirmation.
The first condition to monitor is a completed 4-hour candle close above D Zone High. Participation and volume should also be observed to determine whether the breakout is being accepted by the market.
3. Retest Condition
After a confirmed 4-hour close above D Zone High, price may return to test the same level.
If the retest holds, the former resistance area may begin acting as structural support. This would provide stronger confirmation that price is being accepted above the previous range.
If price falls back into the consolidation range, the breakout remains unconfirmed and the possibility of a false breakout should be considered.
4. Role of T2 and T3
T2 remains the major support reference for the consolidation range.
T3 acts as an intermediate structural level. Holding above T3 shows improving market structure, but D Zone High must still be broken and successfully retested before continuation can be confirmed.
5. Risk and Limitations
The dashed path in this chart represents only a conditional breakout-and-retest scenario. It is not a prediction of future price movement.
This chart is an educational illustration and does not display live market data. T2, T3, D Zone High and volume levels are analytical references only and do not guarantee any trading outcome.
Traders should verify the live chart and apply independent risk management before making any decision.
Related public invite-only script:
Volume Structure Navigator Promax
---
本篇HOW-TO說明如何使用Volume Structure Navigator Promax,觀察BTCUSDT四小時週期的盤整、突破與回測結構。
一、目前結構
圖中BTCUSD目前處於T2與D Zone High之間的盤整區間。
T2代表盤整區下方的重要結構支撐,而D Zone High則是價格尚未確認突破的上方邊界。
近期K線已經移動至T3上方,並開始在T3之上站穩,代表短期結構逐漸改善;但目前尚未確認價格已經完全突破整個盤整區間。
二、突破條件
價格只有影線短暫穿越D Zone High,不能視為完整突破。
首先應觀察四小時K線能否正式收盤站上D Zone High,同時搭配成交量與市場參與程度,判斷市場是否真正接受突破後的價格。
三、回測條件
四小時K線確認收在D Zone High上方後,價格可能返回測試同一個位置。
如果回測能夠守穩,原本的壓力區便可能轉變為新的結構支撐,進一步提高價格被市場接受在原盤整區上方的可能性。
如果價格重新跌回盤整區內,代表突破仍未確認,也必須考慮假突破的可能。
四、T2與T3的作用
T2仍然是整個盤整區的重要支撐參考。
T3則是區間內的中繼結構位置。價格站穩T3代表市場結構有所改善,但仍需突破並成功回測D Zone High,才能取得更完整的延續確認。
五、風險與限制
圖中的虛線走勢只代表符合條件時的「突破與回測情境」,並不是對未來價格的預測。
本圖屬於教學示意,並非即時市場行情。T2、T3、D Zone High及成交量位置都只是分析參考,不能保證任何交易結果。
採取任何決策前,仍應核對即時圖表並自行執行風險管理。
相關Public Invite-only腳本:
Volume Structure Navigator Promax
1. Current Structure
BTCUSD is currently shown consolidating between T2 and D Zone High.
T2 represents the lower structural support of the range, while D Zone High remains the upper boundary that price has not yet confirmed as broken.
Recent candles have moved above T3 and are beginning to hold above this level. This indicates an improvement in the short-term structure, but it does not yet confirm a complete breakout from the consolidation range.
2. Breakout Condition
A wick above D Zone High alone is not sufficient confirmation.
The first condition to monitor is a completed 4-hour candle close above D Zone High. Participation and volume should also be observed to determine whether the breakout is being accepted by the market.
3. Retest Condition
After a confirmed 4-hour close above D Zone High, price may return to test the same level.
If the retest holds, the former resistance area may begin acting as structural support. This would provide stronger confirmation that price is being accepted above the previous range.
If price falls back into the consolidation range, the breakout remains unconfirmed and the possibility of a false breakout should be considered.
4. Role of T2 and T3
T2 remains the major support reference for the consolidation range.
T3 acts as an intermediate structural level. Holding above T3 shows improving market structure, but D Zone High must still be broken and successfully retested before continuation can be confirmed.
5. Risk and Limitations
The dashed path in this chart represents only a conditional breakout-and-retest scenario. It is not a prediction of future price movement.
This chart is an educational illustration and does not display live market data. T2, T3, D Zone High and volume levels are analytical references only and do not guarantee any trading outcome.
Traders should verify the live chart and apply independent risk management before making any decision.
Related public invite-only script:
Volume Structure Navigator Promax
---
本篇HOW-TO說明如何使用Volume Structure Navigator Promax,觀察BTCUSDT四小時週期的盤整、突破與回測結構。
一、目前結構
圖中BTCUSD目前處於T2與D Zone High之間的盤整區間。
T2代表盤整區下方的重要結構支撐,而D Zone High則是價格尚未確認突破的上方邊界。
近期K線已經移動至T3上方,並開始在T3之上站穩,代表短期結構逐漸改善;但目前尚未確認價格已經完全突破整個盤整區間。
二、突破條件
價格只有影線短暫穿越D Zone High,不能視為完整突破。
首先應觀察四小時K線能否正式收盤站上D Zone High,同時搭配成交量與市場參與程度,判斷市場是否真正接受突破後的價格。
三、回測條件
四小時K線確認收在D Zone High上方後,價格可能返回測試同一個位置。
如果回測能夠守穩,原本的壓力區便可能轉變為新的結構支撐,進一步提高價格被市場接受在原盤整區上方的可能性。
如果價格重新跌回盤整區內,代表突破仍未確認,也必須考慮假突破的可能。
四、T2與T3的作用
T2仍然是整個盤整區的重要支撐參考。
T3則是區間內的中繼結構位置。價格站穩T3代表市場結構有所改善,但仍需突破並成功回測D Zone High,才能取得更完整的延續確認。
五、風險與限制
圖中的虛線走勢只代表符合條件時的「突破與回測情境」,並不是對未來價格的預測。
本圖屬於教學示意,並非即時市場行情。T2、T3、D Zone High及成交量位置都只是分析參考,不能保證任何交易結果。
採取任何決策前,仍應核對即時圖表並自行執行風險管理。
相關Public Invite-only腳本:
Volume Structure Navigator Promax
註釋
Correction: This publication uses BINANCE:BTCUSDT on the 4-hour timeframe. References to BTCUSD in the original description and illustration should read BTCUSDT. The structure analysis remains unchanged.更正:本篇實際分析商品為 BINANCE:BTCUSDT,週期為4小時。原文及教學示意圖中的BTCUSD均應更正為BTCUSDT,結構分析邏輯不變。

專注量價結構、突破與回測|關注PriceFloorLabs,取得BTCUSDT、ETHUSD及其他市場更新。
Price-volume structure, breakouts & retests. Follow for market updates.
Pro: Volume Structure Navigator Promax
tw.tradingview.com/script/WyMXPljx/
Price-volume structure, breakouts & retests. Follow for market updates.
Pro: Volume Structure Navigator Promax
tw.tradingview.com/script/WyMXPljx/
免責聲明
這些資訊和出版物並非旨在提供,也不構成TradingView提供或認可的任何形式的財務、投資、交易或其他類型的建議或推薦。請閱讀使用條款以了解更多資訊。
專注量價結構、突破與回測|關注PriceFloorLabs,取得BTCUSDT、ETHUSD及其他市場更新。
Price-volume structure, breakouts & retests. Follow for market updates.
Pro: Volume Structure Navigator Promax
tw.tradingview.com/script/WyMXPljx/
Price-volume structure, breakouts & retests. Follow for market updates.
Pro: Volume Structure Navigator Promax
tw.tradingview.com/script/WyMXPljx/
免責聲明
這些資訊和出版物並非旨在提供,也不構成TradingView提供或認可的任何形式的財務、投資、交易或其他類型的建議或推薦。請閱讀使用條款以了解更多資訊。