
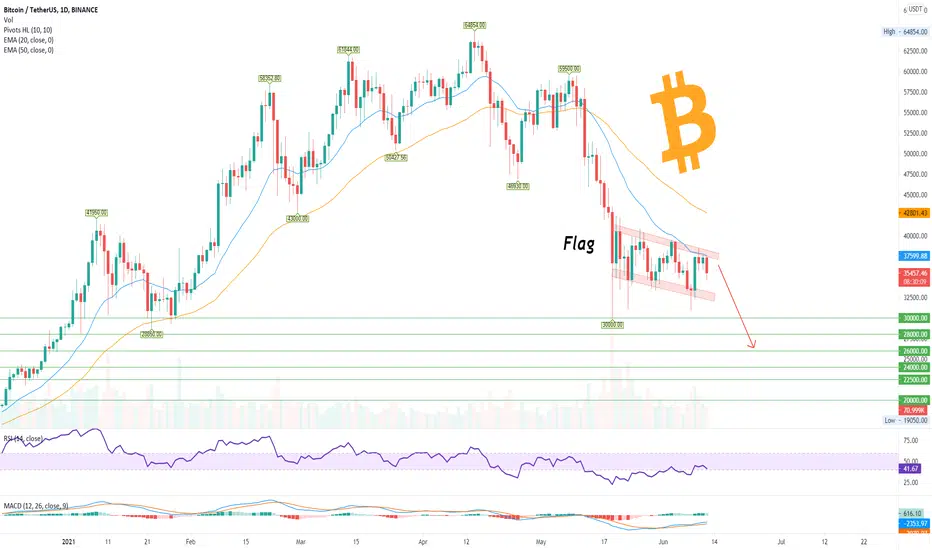
The price of Bitcoin has formed a flag continuation pattern on the daily time frame.
This pattern is ready to move to the downside as the 20 EMA was tested, meaning it has performed the oversold bounce successfully.
Alternatively, the price could be printing a descending triangle pattern with the same bias to break to the downside.
A break below $30000 will confirm bearish outlook.
Support levels.
$28000
$26000
$24000
$22500
$20000
Indicators doesn't show any bullish signals.
I look to buy Bitcoin at these bespoke levels, meaning I am buying this dip below $30000.
Not a financial advice though! Good luck.
This pattern is ready to move to the downside as the 20 EMA was tested, meaning it has performed the oversold bounce successfully.
Alternatively, the price could be printing a descending triangle pattern with the same bias to break to the downside.
A break below $30000 will confirm bearish outlook.
Support levels.
$28000
$26000
$24000
$22500
$20000
Indicators doesn't show any bullish signals.
I look to buy Bitcoin at these bespoke levels, meaning I am buying this dip below $30000.
Not a financial advice though! Good luck.

相關出版品
免責聲明
這些資訊和出版物並非旨在提供,也不構成TradingView提供或認可的任何形式的財務、投資、交易或其他類型的建議或推薦。請閱讀使用條款以了解更多資訊。