
Hello my dear friends
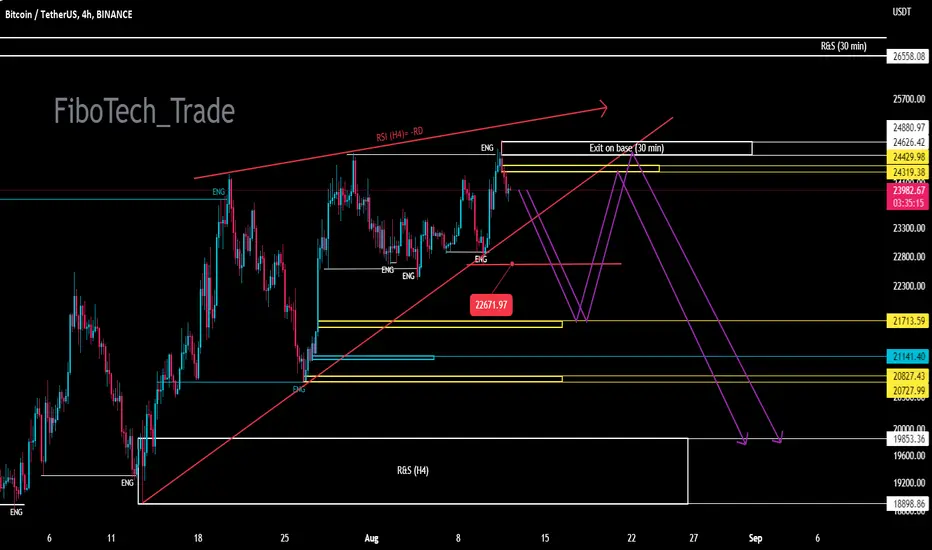
In your opinion, how valid is the drawn pattern?!?!?
We will not have the mindset to form a bearish trend until the corrective trend is below the $22,671.97 price range.
Don't forget the marked white and yellow ranges ($24,319 & $24,626) are valid after the $22,671.97 price range is fully consumed!
We would be happy to hear your comments.
In your opinion, how valid is the drawn pattern?!?!?
We will not have the mindset to form a bearish trend until the corrective trend is below the $22,671.97 price range.
Don't forget the marked white and yellow ranges ($24,319 & $24,626) are valid after the $22,671.97 price range is fully consumed!
We would be happy to hear your comments.
交易進行
It has activated all the higher areas!For now, no signal has been issued to continue the upward trend!!!
These increasing trends seem to be more to activate the limit of losses and collect the necessary liquidity for strange downward movements):
交易進行
The downward trend line was broken and a lower price floor was formed. So, the first approval for changing the process was issued.
Now we have to keep in mind that this morning we have a candle with a shadow from above.
The shadow of the candlestick shows us that there is a high probability of forming an upward trend and reacting to the yellow area ($24993.66). But we have to check depending on the type of the current trend, the downward trend will continue from the yellow area to what area!
交易結束:目標達成

免責聲明
這些資訊和出版物並非旨在提供,也不構成TradingView提供或認可的任何形式的財務、投資、交易或其他類型的建議或推薦。請閱讀使用條款以了解更多資訊。