
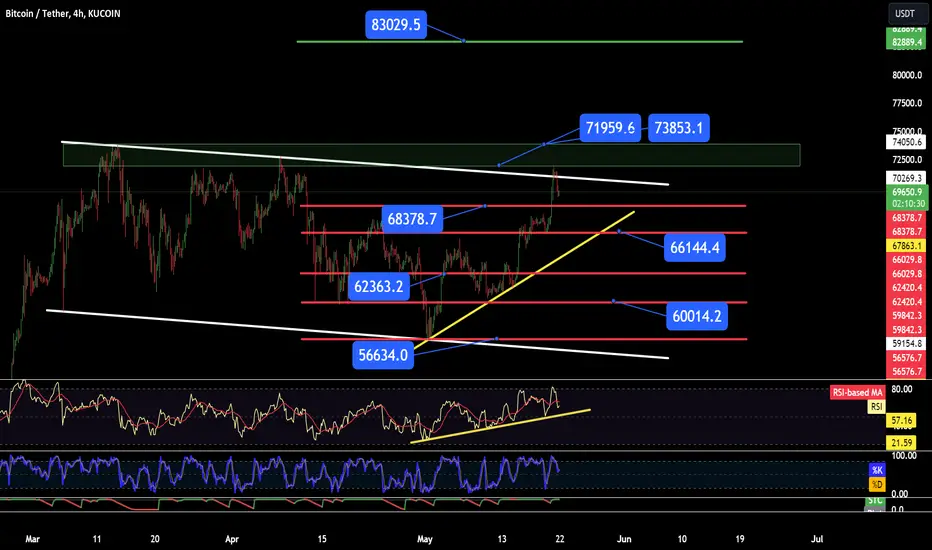
Hello everyone, let's take a look at the 4H BTC to USDT chart as we can see that the price has bounced off the upper boundary of the downtrend channel, potentially giving room for a stronger downward move.
However, if BTC tries to exit the channel again, the price must overcome a very strong resistance zone from $71,959 to $73,853. However, after breaking above this resistance zone, an upward impulse to the area of $83,029 will be possible.
Now let's move on to the stop loss in case of further market declines:
SL1 = $68,378
SL2 = $66,144
SL3 = $62,363
SL4 = $60,014
AND
SL5 = $56,634
Looking at the RSI indicators and the STOCH indicator, you can see how both of these indicators rebounded from the upper limit, which resulted in a downward price movement, with room for the price to recover more. It is worth mentioning here that the RSI indicator has approached the upward trend line, which is worth watching because relying on it may again result in an upward movement.
However, if BTC tries to exit the channel again, the price must overcome a very strong resistance zone from $71,959 to $73,853. However, after breaking above this resistance zone, an upward impulse to the area of $83,029 will be possible.
Now let's move on to the stop loss in case of further market declines:
SL1 = $68,378
SL2 = $66,144
SL3 = $62,363
SL4 = $60,014
AND
SL5 = $56,634
Looking at the RSI indicators and the STOCH indicator, you can see how both of these indicators rebounded from the upper limit, which resulted in a downward price movement, with room for the price to recover more. It is worth mentioning here that the RSI indicator has approached the upward trend line, which is worth watching because relying on it may again result in an upward movement.

免責聲明
這些資訊和出版物並非旨在提供,也不構成TradingView提供或認可的任何形式的財務、投資、交易或其他類型的建議或推薦。請閱讀使用條款以了解更多資訊。
免責聲明
這些資訊和出版物並非旨在提供,也不構成TradingView提供或認可的任何形式的財務、投資、交易或其他類型的建議或推薦。請閱讀使用條款以了解更多資訊。