
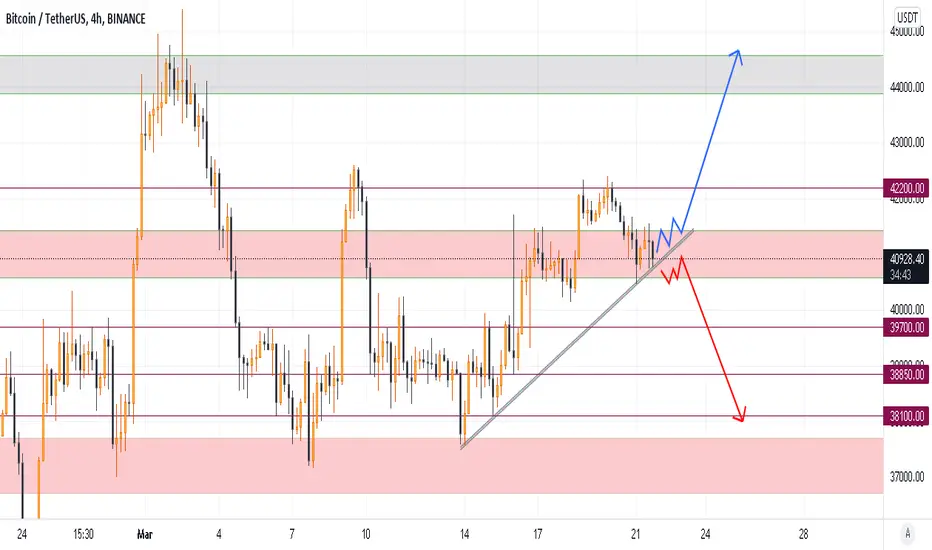
Hey Everyone, This is BTC Short Term Chart Technical Analysis which shows of course two scenarios but clear levels for trading.
The Trade set up is as follow:
If the Support trend line broke, we will wait for a pullback and confirmation which do not be a Fakeout then we will enter a short position with a stop loss above the support trend line and our targets are: 39700, 38850, 38100, 37000.
Or if the Price and candles remained above this support trend line we can open a long position for targets 42200, 44000 for short term.
Do not forget that this is not a buy or sell advice it's just my own opinion and technical Analysis. Do consider risks and manage it well.
Good Luck everyone.

免責聲明
這些資訊和出版物並非旨在提供,也不構成TradingView提供或認可的任何形式的財務、投資、交易或其他類型的建議或推薦。請閱讀使用條款以了解更多資訊。
免責聲明
這些資訊和出版物並非旨在提供,也不構成TradingView提供或認可的任何形式的財務、投資、交易或其他類型的建議或推薦。請閱讀使用條款以了解更多資訊。