
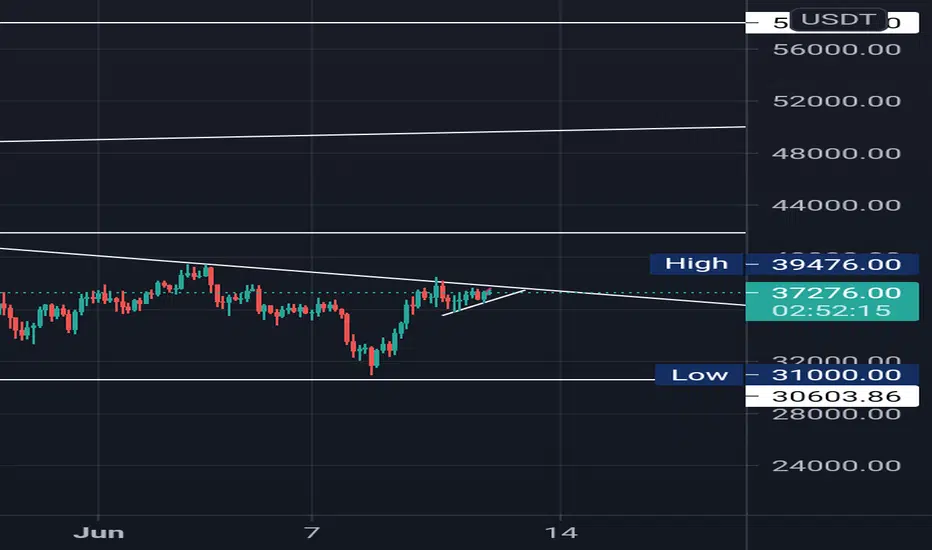
After 30,000 low
On 1D time frame we can see a descending triangle.
When we move to 4hr chart one more pattern " symmetric triangle " forming at the resistance of descending triangle (1D)
Moving at 15 min chart noticed a flag and pole condition the rsi was indicating OB.
I've entered at 37095 with sl or 36375 and target with 40,000 as round figure and 41900 (t2)
On 1D time frame we can see a descending triangle.
When we move to 4hr chart one more pattern " symmetric triangle " forming at the resistance of descending triangle (1D)
Moving at 15 min chart noticed a flag and pole condition the rsi was indicating OB.
I've entered at 37095 with sl or 36375 and target with 40,000 as round figure and 41900 (t2)

免責聲明
這些資訊和出版物並非旨在提供,也不構成TradingView提供或認可的任何形式的財務、投資、交易或其他類型的建議或推薦。請閱讀使用條款以了解更多資訊。
免責聲明
這些資訊和出版物並非旨在提供,也不構成TradingView提供或認可的任何形式的財務、投資、交易或其他類型的建議或推薦。請閱讀使用條款以了解更多資訊。