
Hello traders!
Oscillators are the most popular instruments of TA. Thus, I wanna extend the pool of your oscillators. So, ladies and gentlemen , today we’ll speak about True Strength Index.
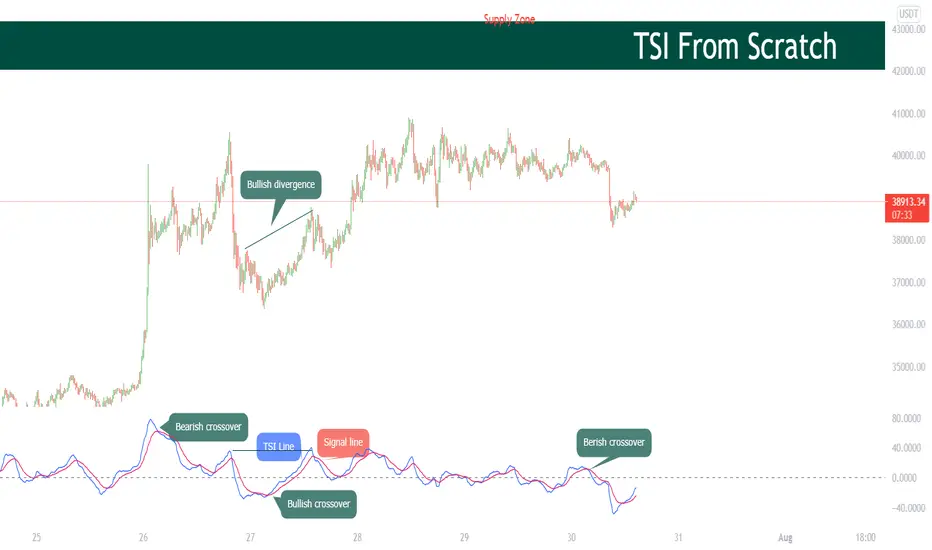
The true strength index (TSI) is a technical momentum oscillator used to identify trends and reversals. The indicator may be useful for determining overbought and oversold conditions, indicating potential trend direction changes via centerline or signal line crossovers, and warning of trend weakness through divergence. The TSI fluctuates between positive and negative territory. Positive territory means the bulls are more in control of the asset. Negative territory means the bears are more in control.
Possible signals of TSI
-Signal line crossovers. When the TSI LINE (blue) crosses the signal line above it’s bullish signal, when below - bearish.
-Zero line crossover. When the TSI LINE (blue) crosses the zero line above it’s bullish signal, when below - bearish.
-Divergencies. One of the most common signals of any oscillator.
Well, I hope it’s really useful for you and you find it informative. Have a nice weekend traders

免責聲明
這些資訊和出版物並非旨在提供,也不構成TradingView提供或認可的任何形式的財務、投資、交易或其他類型的建議或推薦。請閱讀使用條款以了解更多資訊。