
Hey there everyone,
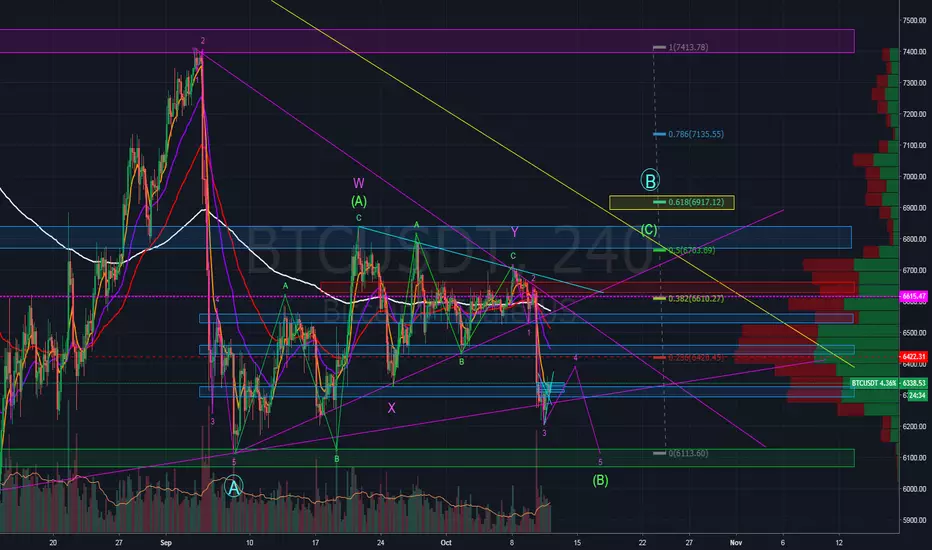
Here is an extensive short term technical analysis chart analyzing a possible move up before we see more of a Red October/November. I published an analysis a few days ago but I realized that I drew the "X,Y,Z" labels in the wrong place.
This new analysis is based off of "Figure 1-47" in the Robert Preacher, and A.J. Frost Elliot Wave Theory book, in which they illustrate how possbile X,Y,Z double three combos can play out.
Long story short, there is a possibility that we could test the 6850 region again before dropping; A Fibonnaci 1:1 extension target from there would put us in the 5500-5600 region, but I would hope that 5750 would hold.
Let me know what you think! All critiques are welcome. I want to learn!
When Moon?
Here is an extensive short term technical analysis chart analyzing a possible move up before we see more of a Red October/November. I published an analysis a few days ago but I realized that I drew the "X,Y,Z" labels in the wrong place.
This new analysis is based off of "Figure 1-47" in the Robert Preacher, and A.J. Frost Elliot Wave Theory book, in which they illustrate how possbile X,Y,Z double three combos can play out.
Long story short, there is a possibility that we could test the 6850 region again before dropping; A Fibonnaci 1:1 extension target from there would put us in the 5500-5600 region, but I would hope that 5750 would hold.
Let me know what you think! All critiques are welcome. I want to learn!
When Moon?
註釋
With XBT CBOE futures closing on October 17th, we should see bitcoin around 6100 before we make the move up to 6800s. 6100 would complete an impulse wave down, and complete the intermediate “B” wave here from the larger trends “A”, to “B”.
免責聲明
這些資訊和出版物並非旨在提供,也不構成TradingView提供或認可的任何形式的財務、投資、交易或其他類型的建議或推薦。請閱讀使用條款以了解更多資訊。
免責聲明
這些資訊和出版物並非旨在提供,也不構成TradingView提供或認可的任何形式的財務、投資、交易或其他類型的建議或推薦。請閱讀使用條款以了解更多資訊。