
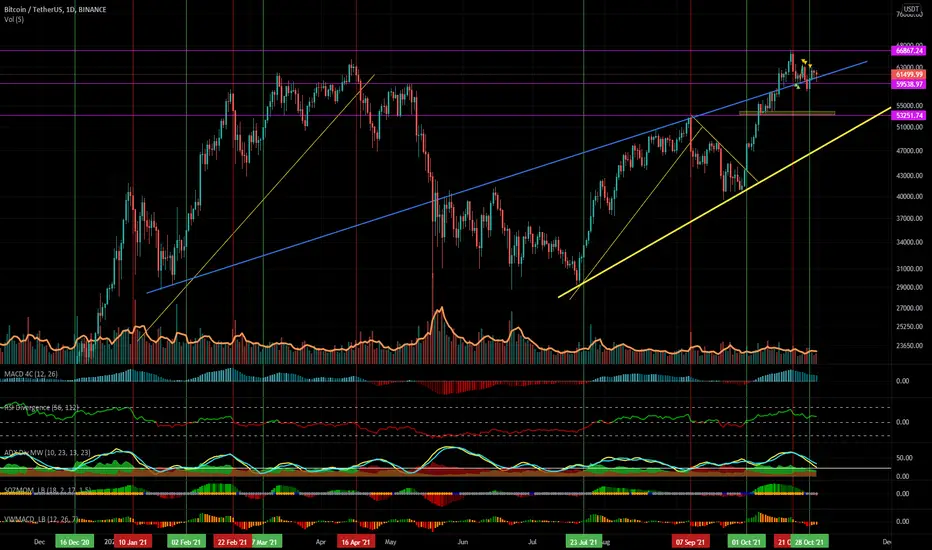
It's good to regularly zoom out on a chart to get a better understanding of what's happening in the wider scheme. Looking at this chart we can see that we have had a very strong move up from the corrective low and she just needed to cool off a little. In the past few weeks BTC has been trading in a range between $60K and $67K. All attempts to break down from this zone have failed. We are still well above the long term trend (thick yellow line). The most significant influences on its current price are two support trend lines. One is the purple support line from previous highs, and the other (blue) is a longer time frame uptrend line that appears to be providing good support for the current price to move up. As I've mentioned previously, price fell below these two and was quickly snapped back up into the demand zone above them.
Price can still fall through these levels but if it does there are quite a few lines of support to and demand to catch it. So I'm still bullish and with significant support sitting below the current price there is a good probability that we will see more upside to price action.
Price can still fall through these levels but if it does there are quite a few lines of support to and demand to catch it. So I'm still bullish and with significant support sitting below the current price there is a good probability that we will see more upside to price action.

免責聲明
這些資訊和出版物並非旨在提供,也不構成TradingView提供或認可的任何形式的財務、投資、交易或其他類型的建議或推薦。請閱讀使用條款以了解更多資訊。