
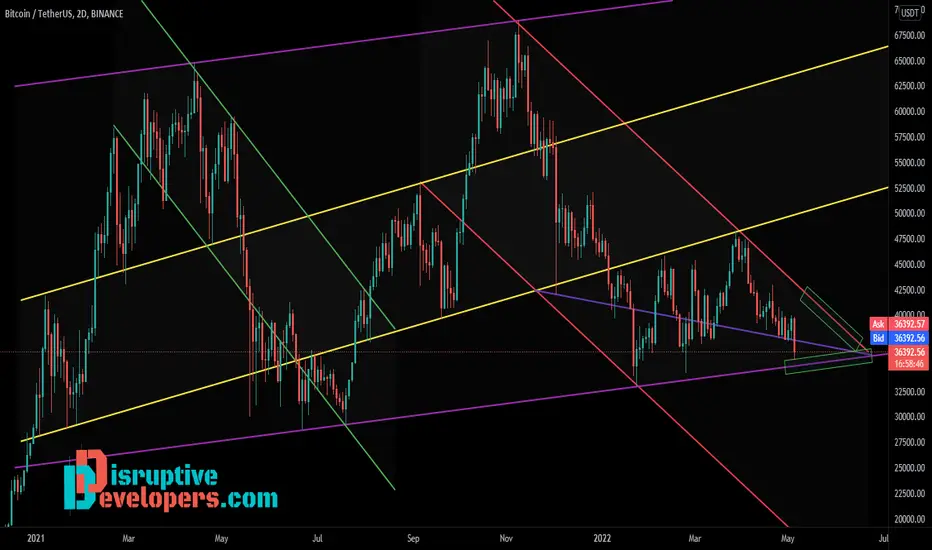
This chart shows my thoughts on the Higher Time Frame (HTF) for BTC .
Most people have a Higher Time Frame (HTF) chart, what does yours look like?
Parallel Channels
This chart is on a 2 day timeframe, it consist of several parallel channels. Price wicked into my green box of interest at the bottom of the violet channel. Channels and trendlines can act as great support and resistance.
I have an alert set for 35400, if this fires I will reassess and potentially prepare for a long trade.

免責聲明
這些資訊和出版物並非旨在提供,也不構成TradingView提供或認可的任何形式的財務、投資、交易或其他類型的建議或推薦。請閱讀使用條款以了解更多資訊。