
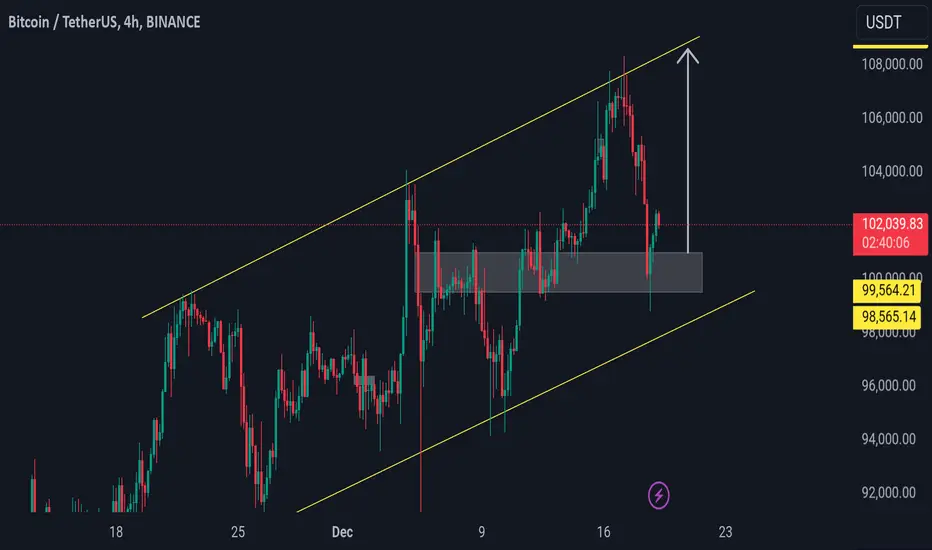
BTC/USDT: Bouncing Back Strong from Key Support
Bitcoin (BTC/USDT) is showing resilience 💪 as it rebounds from a critical support level, signaling potential bullish momentum ahead 📈. This key level has previously acted as a launchpad for strong upward moves, and the current price action hints at a similar scenario unfolding 🚀.
Key insights:
1. Strong support zone: BTC has bounced off a well-established support area, reinforcing its importance as a demand zone.
2. Momentum shift: Indicators like RSI and MACD are turning upward ⚡, hinting at renewed buyer interest.
3. Volume increase: Early signs of increasing volume suggest that bulls are stepping back into the market 🔥.
Steps to confirm the uptrend:
Watch for a clear 4H or daily candle close above immediate resistance levels 📍.
Monitor trading volume; a surge in volume during upward moves strengthens the bullish case 📊.
Look for higher highs and higher lows on the charts to confirm a trend reversal 📈.
Risk management strategies:
Set a stop-loss below the support level to limit potential losses 🔒.
Scale into positions gradually as bullish confirmation develops 🎯.
Avoid overleveraging; position size should align with your overall trading plan ✅.
Important note:
This analysis is for educational purposes only and not financial advice. Always conduct your own research (DYOR) 🔍 and trade responsibly.
Bitcoin (BTC/USDT) is showing resilience 💪 as it rebounds from a critical support level, signaling potential bullish momentum ahead 📈. This key level has previously acted as a launchpad for strong upward moves, and the current price action hints at a similar scenario unfolding 🚀.
Key insights:
1. Strong support zone: BTC has bounced off a well-established support area, reinforcing its importance as a demand zone.
2. Momentum shift: Indicators like RSI and MACD are turning upward ⚡, hinting at renewed buyer interest.
3. Volume increase: Early signs of increasing volume suggest that bulls are stepping back into the market 🔥.
Steps to confirm the uptrend:
Watch for a clear 4H or daily candle close above immediate resistance levels 📍.
Monitor trading volume; a surge in volume during upward moves strengthens the bullish case 📊.
Look for higher highs and higher lows on the charts to confirm a trend reversal 📈.
Risk management strategies:
Set a stop-loss below the support level to limit potential losses 🔒.
Scale into positions gradually as bullish confirmation develops 🎯.
Avoid overleveraging; position size should align with your overall trading plan ✅.
Important note:
This analysis is for educational purposes only and not financial advice. Always conduct your own research (DYOR) 🔍 and trade responsibly.

🚀 Join My Telegram Community for FREE trading signals, entry/exit points, and instant updates!
👉 t.me/cryptobyghazii
🔥 For quick scalping & high volatility trading, Join Me Here
👉 t.me/qaisranitrades
👉 t.me/cryptobyghazii
🔥 For quick scalping & high volatility trading, Join Me Here
👉 t.me/qaisranitrades
免責聲明
這些資訊和出版物並非旨在提供,也不構成TradingView提供或認可的任何形式的財務、投資、交易或其他類型的建議或推薦。請閱讀使用條款以了解更多資訊。
🚀 Join My Telegram Community for FREE trading signals, entry/exit points, and instant updates!
👉 t.me/cryptobyghazii
🔥 For quick scalping & high volatility trading, Join Me Here
👉 t.me/qaisranitrades
👉 t.me/cryptobyghazii
🔥 For quick scalping & high volatility trading, Join Me Here
👉 t.me/qaisranitrades
免責聲明
這些資訊和出版物並非旨在提供,也不構成TradingView提供或認可的任何形式的財務、投資、交易或其他類型的建議或推薦。請閱讀使用條款以了解更多資訊。