
Hi Traders,
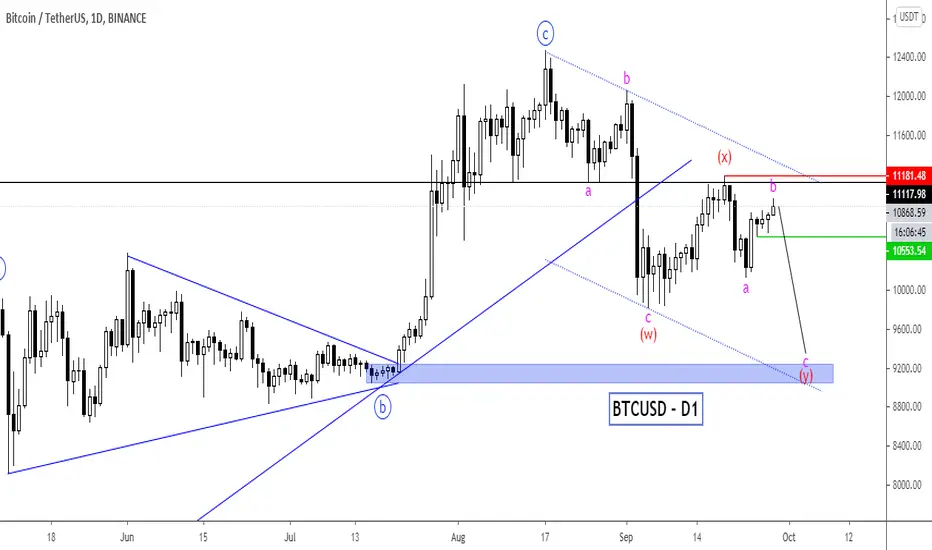
In the Bitcoin daily chart above, price broke the ascending trendline and support level impulsively.
Price has then retested the broken support as resistance and moving lower gradually. The pattern on the chart can also be seen as an Elliot Wave double zigzag pattern.
The first zigzag as completed in wave (w), followed by the double zigzag connector in wave (x). Price is now making the second zigzag in which wave a is completed and the price is currently in wave b.
As long as the price stays below the red line (wave a high), we should be anticipating a sell-off in wave c of (y).
I will be watching how this plays out in the days ahead.
What's your view on Bitcoin? Let me know in the comment.
Best of luck on the chart.
Veejahbee.
In the Bitcoin daily chart above, price broke the ascending trendline and support level impulsively.
Price has then retested the broken support as resistance and moving lower gradually. The pattern on the chart can also be seen as an Elliot Wave double zigzag pattern.
The first zigzag as completed in wave (w), followed by the double zigzag connector in wave (x). Price is now making the second zigzag in which wave a is completed and the price is currently in wave b.
As long as the price stays below the red line (wave a high), we should be anticipating a sell-off in wave c of (y).
- * The setup will be invalidated if the price breaches the red line.
* The breach of the green line will confirm the bears have resumed.
I will be watching how this plays out in the days ahead.
What's your view on Bitcoin? Let me know in the comment.
Best of luck on the chart.
Veejahbee.

免責聲明
這些資訊和出版物並非旨在提供,也不構成TradingView提供或認可的任何形式的財務、投資、交易或其他類型的建議或推薦。請閱讀使用條款以了解更多資訊。