
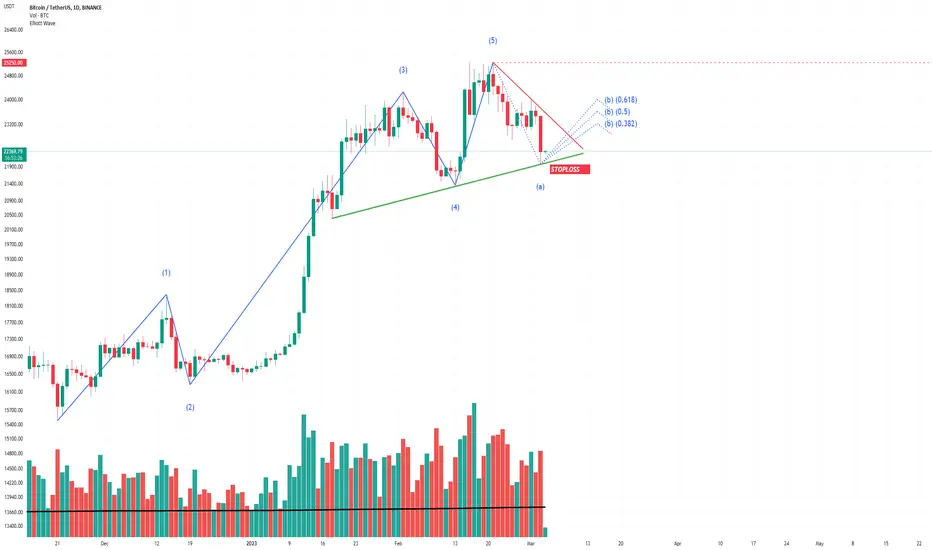
As you can see the main trend lines are on the chart.
The Trading View's Elliot Wave projection suggests going around the next resistance IF the current correction is over and if not, the stop loss will be triggered based on the support's break.
Since we are near a good support of the main up trend, there is a good risk to reward Ratio for going long.
Green trend line is the stop loss, any price action passing it is a red flag.
Red trend line can be used as the take profit.
The Trading View's Elliot Wave projection suggests going around the next resistance IF the current correction is over and if not, the stop loss will be triggered based on the support's break.
Since we are near a good support of the main up trend, there is a good risk to reward Ratio for going long.
Green trend line is the stop loss, any price action passing it is a red flag.
Red trend line can be used as the take profit.
交易結束:達到停損點
Bulls are trying hard but bears have the upper hand and DXY is helping them so far.
免責聲明
這些資訊和出版物並非旨在提供,也不構成TradingView提供或認可的任何形式的財務、投資、交易或其他類型的建議或推薦。請閱讀使用條款以了解更多資訊。