
Bitcoin "Channel" Breakout Analysis
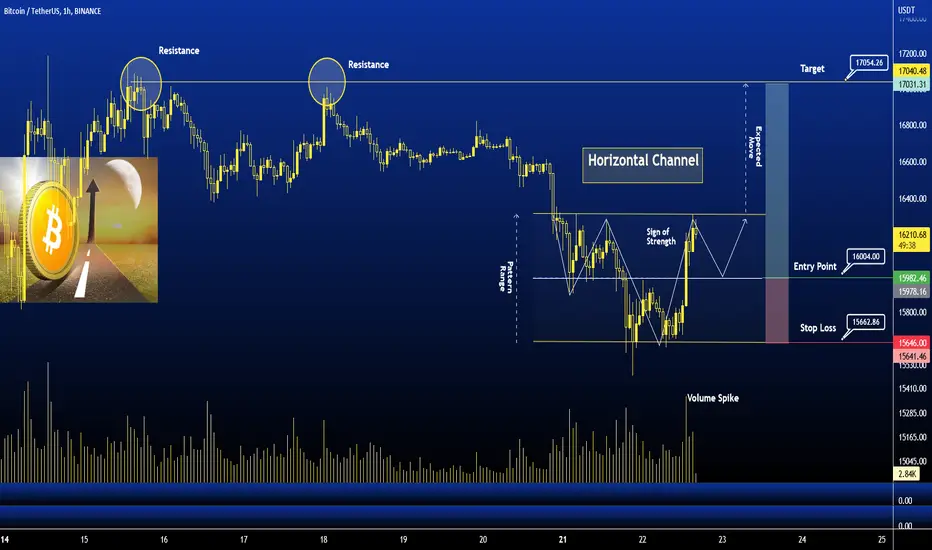
The above chart of Bitcoin laid out the Horizontal channel pattern. Horizontal channel pattern also known as the sideways trend. In general, the horizontal channel is formed during the price consolidation. In this pattern, the upper trendline, the line which connects the highs, and the lower trendline, line which connects the lows, run horizontally parallel and the price action is contained within it. A horizontal channel is often regarded as one of the suitable patterns for timing the market as the buying and selling points are in consolidation.
Currently, Bitcoin is in the range of $16189. If the pattern continues, the price of Bitcoin might reach the resistance levels of $17050 If the trend reverses, then the price of Bitcoin may fall to $15660
Key Points : Bullish Candle and Volume Spike
Happy Trading
The above chart of Bitcoin laid out the Horizontal channel pattern. Horizontal channel pattern also known as the sideways trend. In general, the horizontal channel is formed during the price consolidation. In this pattern, the upper trendline, the line which connects the highs, and the lower trendline, line which connects the lows, run horizontally parallel and the price action is contained within it. A horizontal channel is often regarded as one of the suitable patterns for timing the market as the buying and selling points are in consolidation.
Currently, Bitcoin is in the range of $16189. If the pattern continues, the price of Bitcoin might reach the resistance levels of $17050 If the trend reverses, then the price of Bitcoin may fall to $15660
Key Points : Bullish Candle and Volume Spike
Happy Trading
註釋

相關出版品
免責聲明
這些資訊和出版物並非旨在提供,也不構成TradingView提供或認可的任何形式的財務、投資、交易或其他類型的建議或推薦。請閱讀使用條款以了解更多資訊。