
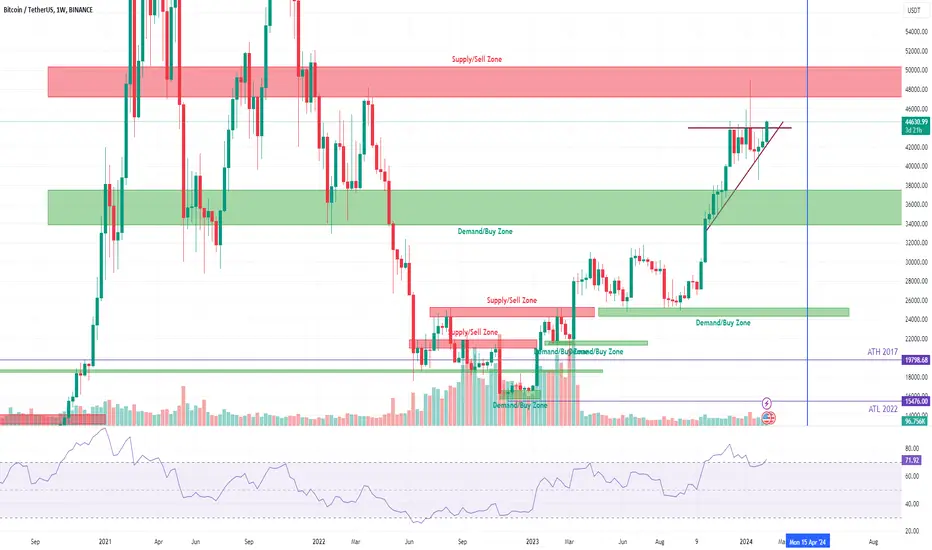
Examining the weekly chart, there are a lot of interesting observations as the Halving approaches in less than 10 weeks.
The price is forming a triangle pattern just below a major resistance level. A sell-off candle followed by a buy back candle cleared the weak hand liquidity within a 3-week span.
Currently, the price bar is consolidating into a triangle edge, which may result in a major breakout. The RSI has been in the oversold territory but is losing strength.
Predicting the direction is challenging, but my money is leaning towards the downside.
#BTC BTCUSDT_W_2024_06
The price is forming a triangle pattern just below a major resistance level. A sell-off candle followed by a buy back candle cleared the weak hand liquidity within a 3-week span.
Currently, the price bar is consolidating into a triangle edge, which may result in a major breakout. The RSI has been in the oversold territory but is losing strength.
Predicting the direction is challenging, but my money is leaning towards the downside.
#BTC BTCUSDT_W_2024_06
交易結束:達到停損點

Learn! Invest! Earn!
免責聲明
這些資訊和出版物並非旨在提供,也不構成TradingView提供或認可的任何形式的財務、投資、交易或其他類型的建議或推薦。請閱讀使用條款以了解更多資訊。
Learn! Invest! Earn!
免責聲明
這些資訊和出版物並非旨在提供,也不構成TradingView提供或認可的任何形式的財務、投資、交易或其他類型的建議或推薦。請閱讀使用條款以了解更多資訊。