
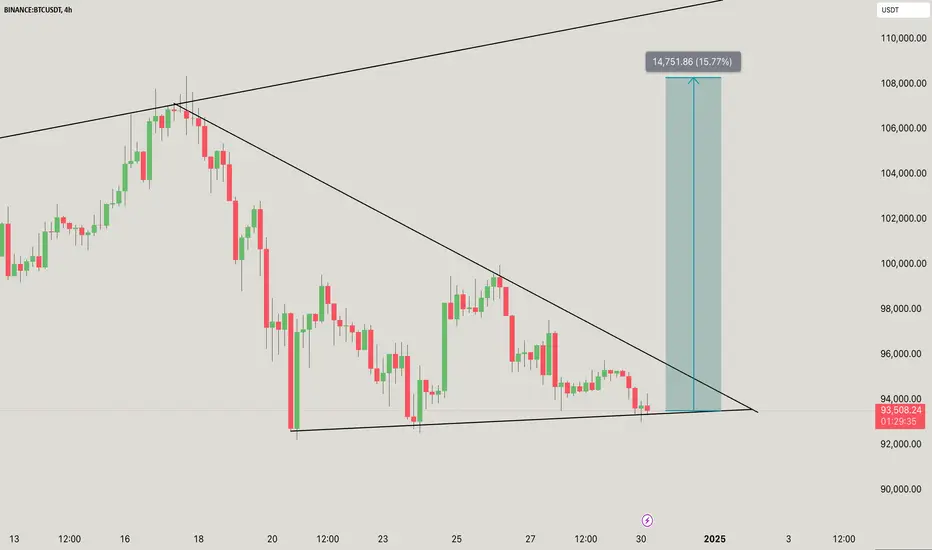
BTC/USDT consolidates within a symmetrical triangle, indicating a potential breakout.
This pattern often translates into a significant price movement, either upwards or downwards.
As highlighted in the chart, if BTC breaks out to the upside, the price projection is approximately 15.77%.
The measured move aligns with historical price action and the triangle's width.
Support Level: Near $93,000
The breakout of the triangle will determine the next directional trend.
Keep an eye on increased trading volume to confirm the validity of the breakout.
If the breakout is bullish: The potential target is $108,000
Let me know if you’d like further assistance or adjustments!
DYOR. NFA

相關出版品
免責聲明
這些資訊和出版物並非旨在提供,也不構成TradingView提供或認可的任何形式的財務、投資、交易或其他類型的建議或推薦。請閱讀使用條款以了解更多資訊。