
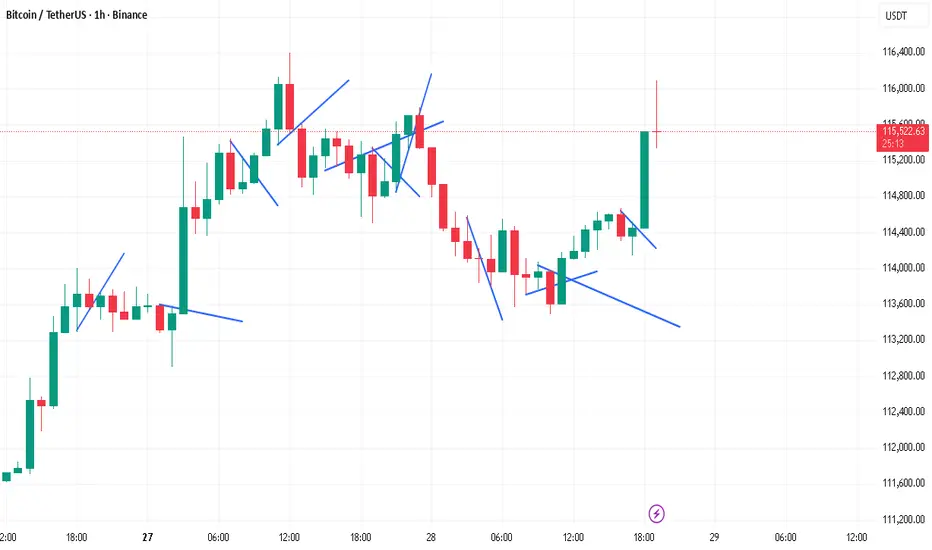
The market is currently in a clear bullish trend, forming consistent higher highs and higher lows. I’ve drawn trendlines to highlight the ongoing upward movement and key support areas that have been respected so far.
When the market approaches a possible reversal point, I prepare in advance by marking the trendline at that zone. My method is simple: I use the high or low of the last two reversal candles to draw the new trendline.
Look closely at the last two candles near each turning point — their highs or lows reveal where the trendline should be placed. This helps visualize where momentum might shift and where a potential reversal could start.
For now, the overall bias remains bullish until the price structure breaks this pattern. I’ll continue watching how price reacts near these trendlines to confirm any changes in direction.
This analysis is for educational purposes only, not financial advice.
When the market approaches a possible reversal point, I prepare in advance by marking the trendline at that zone. My method is simple: I use the high or low of the last two reversal candles to draw the new trendline.
Look closely at the last two candles near each turning point — their highs or lows reveal where the trendline should be placed. This helps visualize where momentum might shift and where a potential reversal could start.
For now, the overall bias remains bullish until the price structure breaks this pattern. I’ll continue watching how price reacts near these trendlines to confirm any changes in direction.
This analysis is for educational purposes only, not financial advice.

免責聲明
這些資訊和出版物並非旨在提供,也不構成TradingView提供或認可的任何形式的財務、投資、交易或其他類型的建議或推薦。請閱讀使用條款以了解更多資訊。