
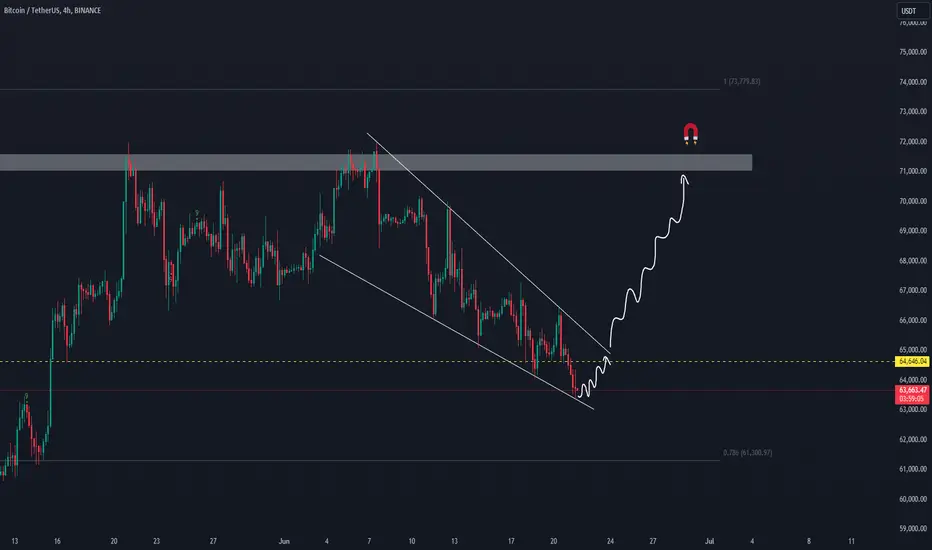
Analyzing the 4-hour Bitcoin chart, we can observe a descending wedge pattern forming. Currently, the price has reached the support line of this formation. If it bounces off this support and breaks through the resistance line, it will confirm the upward momentum. These patterns typically indicate a bullish reversal, leading to a potential rise. Target: Bitcoin (BTC) Target: $71,000, expected to be reached within a week. Let's keep an eye on this pattern for a breakout to confirm the bullish scenario!

免責聲明
這些資訊和出版物並非旨在提供,也不構成TradingView提供或認可的任何形式的財務、投資、交易或其他類型的建議或推薦。請閱讀使用條款以了解更多資訊。
免責聲明
這些資訊和出版物並非旨在提供,也不構成TradingView提供或認可的任何形式的財務、投資、交易或其他類型的建議或推薦。請閱讀使用條款以了解更多資訊。