
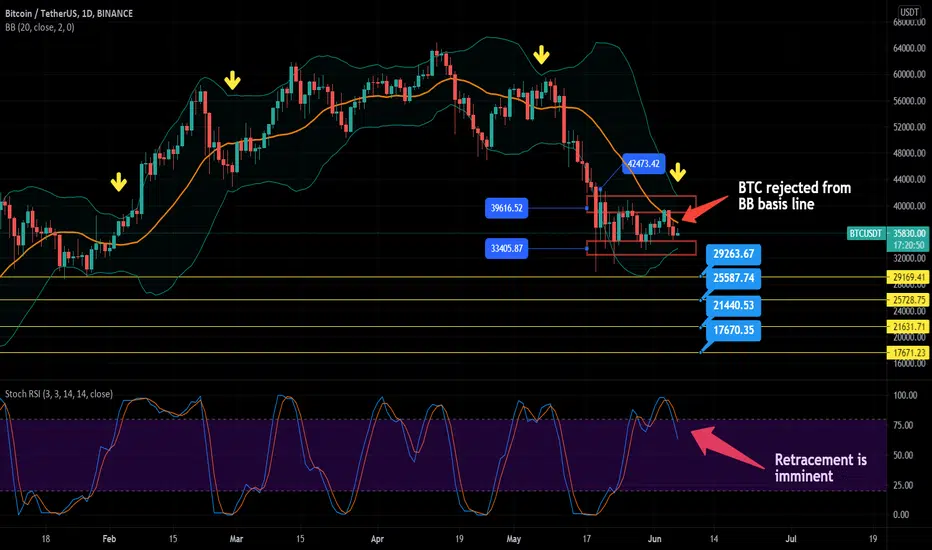
Based on BTC daily chart, it is still consolidating between $33k to $39k range. Usually, the longer the consolidation, the bigger the next move will be.
Based on Bollinger Band indicator, the squeeze of it is so tight where it validates my first statement. The next downtrend move may find support in one of the 4 strong support accordingly. If first support lose, it will go to the next support.
Furthermore, Stochastic RSI is already in the downtrend movement which indicates that a retracement is imminent unless BTC is able to break the Bollinger Band basis line and stay above it. Until then retracement will happen around the corner.
Based on Bollinger Band indicator, the squeeze of it is so tight where it validates my first statement. The next downtrend move may find support in one of the 4 strong support accordingly. If first support lose, it will go to the next support.
Furthermore, Stochastic RSI is already in the downtrend movement which indicates that a retracement is imminent unless BTC is able to break the Bollinger Band basis line and stay above it. Until then retracement will happen around the corner.

相關出版品
免責聲明
這些資訊和出版物並非旨在提供,也不構成TradingView提供或認可的任何形式的財務、投資、交易或其他類型的建議或推薦。請閱讀使用條款以了解更多資訊。