
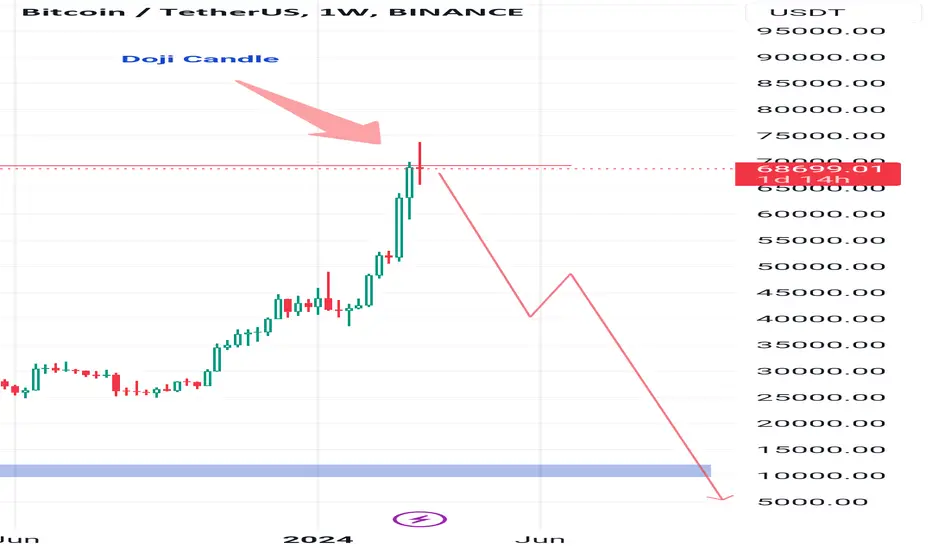
Supply Zone:
A supply zone occurs when the supply of a cryptocurrency exceeds the demand.
In this area, there is excess supply, leading to a falling price.
On a price chart, a supply zone is associated with a downtrend.
Traders often place sell orders in supply zones, expecting prices to decline further.
Imp : forming doji candles in weekly chart
Interpreting Doji Patterns:
Bearish Doji: When a Doji forms at a resistance area, it can signal indecision or a potential trend reversal.
However, the context matters:
If the preceding trend is upward, a bearish Doji may indicate a reversal.
If the preceding trend is downward, it could reinforce the existing bearish sentiment.
A supply zone occurs when the supply of a cryptocurrency exceeds the demand.
In this area, there is excess supply, leading to a falling price.
On a price chart, a supply zone is associated with a downtrend.
Traders often place sell orders in supply zones, expecting prices to decline further.
Imp : forming doji candles in weekly chart
Interpreting Doji Patterns:
Bearish Doji: When a Doji forms at a resistance area, it can signal indecision or a potential trend reversal.
However, the context matters:
If the preceding trend is upward, a bearish Doji may indicate a reversal.
If the preceding trend is downward, it could reinforce the existing bearish sentiment.

免責聲明
這些資訊和出版物並非旨在提供,也不構成TradingView提供或認可的任何形式的財務、投資、交易或其他類型的建議或推薦。請閱讀使用條款以了解更多資訊。
免責聲明
這些資訊和出版物並非旨在提供,也不構成TradingView提供或認可的任何形式的財務、投資、交易或其他類型的建議或推薦。請閱讀使用條款以了解更多資訊。